Ops leaders struggle to assess customer demand related risks in real time. This increases revenue risk. This is a bigger issue amid rising uncertainties like tariffs and inflation (circa 2025). Learn one of the many ways how Zyom helps customers such as Cambium Networks tackle Revenue risks.
Most Operations leaders can’t answer in real time, or even near real time:
Which portion of my planned customer demand is at risk this quarter?
Which orders are at risk?
“At risk” here implies a significant likelihood that customer orders would not materialize, or even if it does, cannot be shipped on time.
Changing signals make it impossible to get demand and supply plans aligned, even using well-crafted spreadsheets and sophisticated, but siloed systems — planning cycles drag, errors creep in, critical Revenue and cross-functional meetings and forums (such as Sales & Ops Planning or S&OP) result in more unanswered questions, and by the time the risks are visible, revenue is already slipping away, or worse (orders lost to competitors).
In times of “garden variety” uncertainty these questions to uncover risk are hard to answer. In an environment of high uncertainty such as now (starting circa Q4 , 2024, to late Q3, 2025 in the US), identifying demand risk has become increasingly frustrating. Largely due to tariffs and pressured trade relations which directly impacts significant trade volumes from partners across the board (larger partners such as the EU, Japan, South Korea, and relatively smaller ones like Vietnam), these risks have increasingly grown for US based product companies. And this without taking into account the slowing employment picture and persistent inflationary trends which, in many industries, is already dampening if not damaging demand.
Branded product manufacturers like Cambium Networks cut planning cycles by 60%-80% and gave key executives and operating team members direct line-of-sight into supply risk with Zyom, starting in 2017. Their SVP of Ops called it “a system that brought our vision to fruition.” Cambium continues to partner with Zyom as it navigates demand corrosive uncertainties.
If you can’t see revenue at risk until the quarter’s target is already slipping, and key operating team members are scrambling to get supply inbound, you’re too late.
Key Questions for COO and Operations team
What is one key system capability from a supply Operations standpoint that companies such as Cambium need to ensure they spot revenue risk as early as possible? How should this capability evolve?
What is one valuable decision prompt that the system can automatically provide to speed up decisions and actions from Supply Operations? This was not technically feasible prior to the advent of the newer generative AI technologies (late 2022 ChatGPT launch). i.e., traditional Machine Learning approaches till the public advent of GenAI (LLM) technologies.
To find out more, drop a comment here, or email us at: products@zyom.com
Sources & Acknowledgement: Zyom’s Cambium Networks Case Study.
John Duvenage provided key inputs to structure and composition.
Disclaimer: Generative AI was not used for composing any of the writeups on this site (including this one). GenAI was used to generate the pictures in this article and for content summarization. At this point of time, there is no plan to use GenAI to generate new content on this site. Readers will be informed in advance if this changes.
Inventory is a critical asset and a dangerous liability; Pointers for the COO to navigate inventory related decisions & actions for the unpredictable times (circa H1, 2025)
This AI generated podcast (using NotebookLM) is based on the text from the Zyom Blog, “Note for the COO: Inventory – the double-edged sword.” It highlights the criticality of effective inventory improvement initiatives, especially amidst market uncertainty. It emphasizes that while adequate inventory can be beneficial, excessive inventory quickly becomes a financial burden, particularly in channel-centric sales models where it can obscure underlying issues.
The author, Rakesh Sharma, stresses that inventory reduction is a strategic initiative, not merely a tactical task, leading to a structural capital advantage that frees up capital for growth. The article describes the “dual mandate” faced by COOs: balancing the need for sufficient stock to meet demand with the imperative to keep inventory levels low to minimize tied-up capital. Ultimately, it advocates optimizing connected operations management processes and increasing velocity of specific end-to-end Planning and Execution processes, to achieve significant capital efficiencies and a sustainable operating advantage.
The author advises caution in following sections of the podcast, since “process velocity” related points can be misunderstood in the AI-generated podcast.
from 6:00 to 6:43 from 7:32 to 7:40 from 8:08 to 8:18
Overall, the Author gives this AI-generated podcast high marks for capturing the key points, and worth a listen.
Please reach out directly through the Contact form provided at the bottom of the April 2, 2025 Zyom Blog in case of questions
The Balancing Act – Buffer to serve customer, vs trapped Capital (generated via GenAI)
Disclaimer: Google’s NotebookLM was used for creating this podcast, which is based on this Zyom blog
Effective inventory management is vital for companies operating across regions, especially during demand uncertainty. While healthy inventory levels provide an advantage, rising inventory levels can become a financial burden quickly. Channel inventory, in particular, can be misleading, masking underlying inefficiencies and costs. This article explores how COOs can increase a company’s focus and optimize inventory across the value network, enhancing efficiency and reducing risks that could undermine even well-run companies. UPDATE – don’t forget the Action section at the end.
In the Finance function “inventory,” as a default, is reported as a “Current Asset.” Ask those in Supply Operations. They’ll tell you that nothing could be farther from the truth. This is especially true in times when demand uncertainty[1] grows.
Managing inventory in companies that manufacture and ship products is a demanding exercise. It requires careful consideration of all the variables that impact demand and supply at various nodes of the value network (not just the supply network). Decisions have to be calibrated using data and inputs across functions – decisions, often based on approximations and imperfect information. And it must be done on an ongoing basis, otherwise important data or signals can slip through the cracks.
It becomes even more complex in cases where companies sell through channel partners (distributors, VARs[2], etc.).
Channel inventory, specifically Distributor inventory, is deceptive. Although, it is no longer on your company’s books, you are not off the hook for it either. Among many things, it depends on the skills of the channel partner in managing inventory and reordering, your contractual relationships, and other factors – such as inventory and ordering patterns across your value network.
If demand changes significantly, then orders for your products can swing up or down. Inventory sitting at your channel partners can also be returned in some cases (“stock rotation” for instance). This can lead to unforeseen reduction in your Revenue. Costs will also increase as you restock your channels with newer products and take receipt of older stock. In times of heightened and persistent demand uncertainty, it does not take too long before inventory is no longer an asset, but more a noose around a company’s neck.
In times of heightened and persistent demand uncertainty, it does not take too long before inventory is no longer an asset, but more a noose around a company’s neck
[1] measured by the rate of change of demand variability and demand volatility; *H1, 2025 has been a period of heightened uncertainty driven by the many sizeable tariffs directed by the US against global trading partners, “reciprocal tariffs” being the latest shell to drop in a scarred global trade-war landscape ; the impact of this on demand uncertainty (variability), already evident in many industry segments (based on direct and secondary data) is yet unfolding.
The dual-mandate of inventory, structural implications
This results in the “dual mandate” faced by the COO and team, balancing two important but opposing needs –
– Carry enough inventory, including buffers, so you fulfill customer orders as needed, as they arrive
And
– Keep Inventory levels low so you do not have too much capital (money) tied up in stock, to run your operations
Compare two companies (illustrative example) –
For example, Company “A” that is carrying $500 Million in average inventory to fulfill $1 Billion of Revenue in a quarter,
versus
Company “B” that’s carrying $300 Million in inventory to fulfill the same level of Revenue – i.e., $1 Billion in a quarter
Company B has a significant structural advantage over company A.
So, inventory reduction is not an arcane, tactical task only to be initiated due to a near-term blip. Go ask your Supply Operations leader[1] to drive down inventory by x% (40%, as in the example above). And everything will be fine.
It is a critical initiative to drive down the capital requirements that gives your company a structural capital advantage. This requires careful attention to details while keeping an eagle-eye on the goal.
If you get this right, you can go much faster up the revenue and growth curve, having more freed up capital via healthy margins to allocate to smart growth (Revenue generating) initiatives.
Get it wrong, and you will not even know something is amiss for a long time. Then things can turn ugly quickly.
Get it (Inventory initiative) wrong, and you will not even know something is amiss for a long time, and then things can turn ugly quickly.
But inventory reduction, especially in channel centered selling models, is even more complex and difficult, as our experience and research shows. This is true whether you manufacture in-house or utilize outsourced manufacturing.
Status quo is often the biggest enemy.
David Cote (ex- CEO of Honeywell) articulates this well with a short story of his experiences as CFO at GE’s major appliance business, in his book – Winning Now, Winning Later (see “References” section at the end).
David’s story provides broad brush strokes on the key leadership mandate and insights gained. As a part of Zyom, we have worked closely with our customers’ cross-functional Operations team and their leadership in the trenches. We have been focused on achieving similar results in operations process optimization for our customers’ operations at physical product companies.
A key part of our customers’ successes has been our ability to collectively dive into the demanding details.
And, in almost all cases, we have come away with surprising findings as we have rolled out our end-to-end planning and execution framework and Operations Management Support (OMS) software system across product companies. Companies that were at different phases of their growth and development cycle.
We do not have inventory reduction numbers that we can share here. What is clear is that by slashing the end-to-end planning cycles by over 80%[2], we helped them achieve significant capital efficiencies – something they had not experienced before. How?
Very briefly – by achieving increased process velocity, across a focused set of end-to-end processes.
by slashing the end-to-end planning cycles by over 80%, we helped our customers achieve significant capital efficiencies – something … not experienced before. How? .. by achieving increased process velocity, across a focused set of end-to-end processes
The sustained[3]structural cost advantages that customers gained has freed up scarce capital which can now be allocated to other critical initiatives. This gives them an unprecedented operating advantage.
[1] working with Channel Sales depending on where inventory is high
[2] Based on analysis conducted and vetted by our customers
[3] Cost advantages achieved are structural (lower inventory levels to ship out the same revenue), hence recurring
Inventory levels rising ? Watch out!
Inventory (specifically, Channel inventory) is a double-edged sword. On the one hand, maintaining near-optimal channel inventory levels provides a competitive edge by ensuring fast and cost-effective order fulfillment. On the other hand, if inventory levels creep up too high, it can quickly become a noose around your neck – a heavy financial burden.
Left unchecked, rising inventory can impair your company’s financial performance in the near to middle term. This due to carrying much higher inventory levels for the amount of revenue shipped.
In case revenue growth shifts or slows down, you will be left holding the bag on ship-loads of inventory (much of which must be written down or written off).
Longer term, this will push your company into a corner, impairing your competitive standing.
As a Chief Operations Officer, you must ensure your inventory optimization initiative always bubble up to the very top. Make this a strategic initiative. Ensure ongoing support from the senior leadership. Mobilize all team members. Ensure it’s not just a tactical one-off.
See the ‘Actions’ block below. Drop us a line. We can share a picture and real-life stories around that. This can help your cross-functional team visualize how our customers and other senior operations leaders have successfully tackled this challenge, steering clear of those insidious inventory icebergs.
Actions for the COO:
How is inventory connected with process cycle time?
How will increasing process velocity help us lower the overall levels of inventory (finished goods, raw-materials and semi-finished stock, work-in-process)?
How should we go about increasing process velocity (which end-to-end processes)?
Have we received any “outsider in” perspectives on how you are making decisions in your value network (not just your supply network) and its impact on inventory? how is it leading sub-optimal inventory?
To learn more contact us here, or below. Stay tuned. As always your comments are a gift to all.
1) (Book) Winning Now, Winning Later: How Companies Can Succeed in the Short Term While Investing for the Long Term Author – David M. Cote
Disclaimer: Generative AI (GenAI) was used in a limited way for improving clarity of sentences only for this article. GenAI was not used for composing any of the writeups on this site (including this one), nor for any data gathering. GenAI was used to generate both the pictures in this article. At this point of time, there is no plan to use Generative AI to generate new content on this site. Readers will be informed in advance if this changes.
As 2025 begins, COOs in the physical goods industries with a global footprint, must focus on two areas – inventory and inflation, amidst global trade and other uncertainties (tariffs etc.). The shifting geopolitical landscape may severely disrupt inventory controls across extended value network (both supply & downstream channel/customer side), and inflate costs. Leaders should closely monitor inventory trends and adapt to inflationary pressures to mitigate potential impacts on margins and operational efficiency.
A note for COOs and team on Inventory & Inflation
(updated Feb 10th, 2025 with tariff changes & rollout updates; previous update Feb 2nd, 2025 with post-tariff imposition data & ADDENDUM at bottom; previous update: Jan 31st, 2025 5:10 pm US PST)
To start off the year 2025, we decided to read the tea leaves a different way – we went looking for clues on what will it look like this year that we should plan and prepare for? what needs to be brought into sharper focus – priorities revisited, big perils identified, collaborations renewed?
This note, for those that are in the physical goods industries – is about what should be top-most priority over the next 30 to 90 days that COO & team should focus and act on. And the focus should not diminish as the year wears on, and beyond.
The Gathering Dust Clouds
The year 2025 – is off to a strange start – a new administration in Washington that, on the surface, appears inclined towards policies which at a meta level, will fragment the world further – at least from a global supply network standpoint. This could potentially realign previously implicit “friendly nation” status, and most likely impact the free flow of goods adversely, increasing procurement costs in the US and inevitably beyond. This, given the tariffs directed at goods from Mexico and Canada among other countries, high on the incoming administration’s wish list (now a reality as of Feb 1st, 2025)
“Wall” of Tariffs, a bigger wall of uncertainty
A wall of worry has unsurprisingly descended on the most senior leaders of product companies with a global footprint, especially COOs and their cross-functional teams managing world-wide operations of US based companies that procure parts and finished manufactured goods from the countries targeted.
While speculations that new US administration’s tariff “statements” were a pre-emptive move to gain a strategic negotiation advantage have been negated by President Trump’s announcement yesterday (Feb 1, 2025), there is nervous optimism that the worst may still not come to pass (i.e., maybe a near-term, a quarter or two out type setback), or so some industry groups hope. [Update – Feb 10, 2025: Tariff implementation continue to be dynamic –
Understandably, anxiety levels are now running high – especially among senior Operations executives who source goods (semi-finished, or finished products) from Mexico and Canada, given the direct, damaging pressure it will put on COGS[1] of even well-run, US based product companies.
That the air in global trade circles is thick with anxiety over the impact of the disruptive changes, is a given. What is less understood is the impact of the inflationary headwinds, the inevitable tit-for-tat type tariff wars and low-trust trade environment will have on midsize companies, and even larger ones that do not have large cash buffers to tide them through.
The picture that emerges – of the damage this does to the balance sheet of (previously) “friendly” nations, many of who are already saddled with debt, does not look pretty. For potential impact numbers see “ADDENUM” below.
This is happening at a time when many industry supply chains could be carrying high levels of potentially excessive “inventory” with a foggy, near-term demand picture. All in all, January-February of 2025 (potentially H1, 2025) is a fraught time, uncertainties abound, especially about global trade and supply networks.
What’s an operations leader to do in such a time? Focus. Focus on these two items not just for now but all year long and beyond.
Focus-1: Inventory
Keep a “Hawk eye” on inventory. Inventory, no matter where it is in your value network – at suppliers, in your DC/WH[1], or at your channel partners, or some mix of these.
Inventory of parts/ raw-materials, semifinished and finished goods.
Pay particularly close attention to components/parts that suppliers may be holding for you, or may have been ordered from component suppliers – Tier 2 or Tier 1, based on the extent of outsourced manufacturing you have deployed.
Keep a sharp focus on how inventories are trending at your channel partners (distributors, VAD[2]s etc.) in the case of channel centric sales model, and/or your largest direct customers, and prepare to take informed actions swiftly to right size channel inventory levels ASAP, when needed.
Keep a sharp focus on how inventories are trending at your channel partners.. your largest direct customers .. prepare to take informed actions swiftly to right size channel inventory levels ASAP
In fact, look at every nook and cranny where high value inventory may be collecting and gathering dust.
Then step back, make informed decisions based on upcoming demand, which in this environment could be much harder to pin down.
Excess inventory can severely disrupt product and technology transitions too – for example, holding back product companies from transitioning products to new hardware/software platform, to key parts, or to an entirely new industry standard. Often, such a transition comes with advantages for the product maker (lower unit costs, better performance, etc.) and their customers (lower price points for similar or better capabilities). With excessive inventory, a product company gets stuck on older versions of their products – unable to obtain the advantages of achieving a lower price point for similar or better output performance for a much longer time, or ever.
A quick point – That end of quarter demand “hockey – stick” needs to be looked at with a new lens too. Today’s hot order, which will put us well over the top end of our quarter target(s), could be a noose around our necks in a quarter or two, or soon thereafter. Change sales incentives if need be. Unusual times call for businesses to not operate “as usual”.
Mind the “inflation gap” – the gap between “newly normalized inflation rates” (macro, estimate of inflation based on ‘aggregated’ data), and what is actually happening (actual inflation rates faced by manufacturers/suppliers in the supply chain).
Yes, Chair Powell and Federal Reserve team have done a heck of a job when it comes to taming the inflation beast, but with uncertain times ahead – unpleasant realities (unanticipated sudden spike*, stubborn or higher inflation, etc.) can come to pass rather quickly.
* In light of the announced Trump Tariffs a sudden spike in inflation is all but guaranteed on some key goods imported from nearshore manufacturing partners Mexico and Canada – food, fuel, autos and electronics to name a few.
As the US and other prime-mover, free market economies, enter an uncertain phase of the business cycle (have we landed yet ? hard or soft landing, or some mix of those?), and the predictable purchasing price inflation caused by tariffs imposed on inbound goods into the US, the job of Supply operations team – planners, procurement and manufacturing – has to be redefined and skills upgraded quickly.
Monitoring impact of inflation on piece parts’ and other key input prices (labor, etc.) will not be a one off that many experienced during the pandemic, but will become a regular feature of their role. And the smartest, forward-thinking operations leaders already get it, and working on capabilities to enhance their team’s performance.
Monitoring impact of inflation on piece parts’ and other key input prices (labor, etc.) will not be a one off that many experienced during the pandemic, but will become a regular feature of their (Supply Operations – Planner, Procurement) role.
They are building better processes enabled by new digital capabilities so procurement/materials management teams are “always on” when it comes to sniffing out an imminent threat of inflation so it can be snuffed out.
Most Operations teams (Procurement, Manufacturing), already went through a bruising time as the shock of the initial lockdowns of the pandemic gave away to the shocking increase in lead times and unit cost of inputs.
This time around it could get a lot tougher. Because, we don’t yet know if we are sliding towards a slowdown or recession – mild, medium or severe – this year (next 2 to 3 quarters are key), or, are we racing down.
For when the chips are (really) down across all product companies, i.e., the downward part of the business cycle, and trading partners are not seeing eye to eye, and inflation rears its head in ugly way – there may be no place to hide.
Your COGS will get a bruising.
Your margins may get neutralized, and you may bleed into the red.
Key Questions & Question the Status Quo
These are the two things for COO and their teams to focus on this year and harness all their collective energies to stay ahead of any potential disruptions. Some key questions to prepare better:
a) What will be the impact of inventory (starting with inventory downstream in the channels/ at customers, working backwards to parts level inventory) if product uptake deviates from plan, or other changes/ events happen which dampen demand or modify it significantly? What key decisions need to be taken? When and how to minimize any adverse impact?
b) How to monitor inflation and its impact on product cost? What specific approach and actions (smart negotiation, smart sourcing among others) can companies deploy to get ahead of the curve on tariffsthat will lead toinflation in procurement costs? What tools will be needed support such actions to mute or mitigate the impact of higher prices? What’s the the best way to measure the impact on product costs (bottom-up, top-down, other) and evaluate options?
As Supply Operations and Demand-gen operations team rush from one quarter to the next, what should the cross-functional teams plan and be prepared for, so they can harness experience, data, insights and tools, including enterprise software, as needed, to:
Plan and prepare for different scenarios (cost changes/ increases, sourcing changes, changes to supply chains, etc.)
Get alerted on deviations in Inventory & Inflation (tariff driven or otherwise)
Make data-informed decisions (clean data available via collaboration is key)
Ensure that learnings from deviations can be captured for the future
Question any responses that sound like “business as usual”.
What can we do?
Reach out and build new partnerships – not just with new physical goods suppliers but with digital (and expertise based) goods suppliers.
Companies (at least in the US) need to start looking inwards within the US, to find reliable, quality manufacturing and other supply sources here – including upstream component & commodity suppliers, assuming their cost structure and business model supports it.
Near term
Start working on establishing relationships with US based manufacturers sooner than you previously thought.
In the near term (current Quarter to 3-4 quarters out), higher quality, cost-competitive US based manufacturers may see their capacity getting quickly gobbled up, as product companies turn inwards. Better to “reserve capacity” now, before you are “shut out”, or are put on a “waiting list”.
New factory capacity and capability takes a long time to come online, be vetted and ready.
And, of course, negotiate with your suppliers in the tariff impacted countries – Mexico and Canada, for now. Its surprising how adversity can create more open channels of collaboration provided these are the right partners.
Longer term
Longer term (2-4 years and beyond) – the jury is still out. However, some of these tariffs may gain wider (not just “populist“) support across policy makers and end customers, and may become sticky in some industries – especially, if it lifts up nation-specific manufacturing capabilities (in this case, lifts up American manufacturing broadly).
So, this may also be the time for longer term plans which may include:
a) vertical integration via acquisition (acquiring the right manufacturers, critical upstream supplier), and/or
b) putting down concrete near-term plans to invest in your own factories here in the US (or wherever the company’s home-base is), with the goal of pouring concrete soon, or acquiring a factory or more, if needed
c) Hone your manufacturing supplier relationship management skills which has been blunted over the past 2+ decades of outsourcing in many industries. No, not the classic sourcing (RFQ based identification of competent suppliers, etc.), but getting waist deep in the trenches with your manufacturing partners – sharing know-how and collaborating deeply on your product specific manufacturing, materials management, collaborative planning, supply chain and even factory operations management. Yes, some skills have been dulled or lost over time. Yet this short-term pain may serve many product companies well – if its used to sharpen these skills again.
These are big changes with potential for big disruptive operational impacts on product companies near-term. However, longer term their effects could be virtuous, if your product company starts planning and preparing now.
To learn more on how we, and our advisors, have specifically helped support our customers, feel free to reach out.
We can share a few specifics, real-life stories, ideas and more of what we have learned working with senior leadership, and their cross functional operations teams across this business cycle and before, across two Fortune 100 companies and smaller, dynamic product enterprises.
Or, leave a comment here That will be music for our ears, and we will respond.
ADDENDUM
New details are emerging about the tariffs and its potential impacts (including price #inflation for US buyers and #supply-shock); some numbers are stark:
A few headline numbers from Bloomberg Economics analysis:
tariffs affect trade worth about $1.3 trillion,
represent 43% of US imports and
impacts roughly 5% of US GDP.
raises the average US tariff rate from near 3% currently to 10.7%, and deal a significant supply shock to the US economy
Utilizing Federal Reserve Board model parameters (from Trump’s first term) suggest this could reduce GDP by 1.2% and add around 0.7% to core PCE (read – inflation).
new tariffs on Canada, Mexico and China will cost the average American household $1,245 in purchasing power (per year), trim GDP by 0.2%
Acknowledgement(s): All customer colleagues we have worked with over the past 15+ years. A special shout-out to the Cambium Networks cross-functional Operations team, and to the insights gained working with cross-functional teams at Samsung Electronics and 2Wire (now CommScope). Michael Dodd (formerly senior Operations executive at Leapfrog, Juniper among others, and advisor to Zyom)
Disclaimer: No Generative AI was used for composing any of the writeups here (including this one), nor for any data gathering; At this point of time, Generative AI is being used in a “limited editor/ summarizer” role only, not to generate any new content on this site. Readers will be informed in advance if this changes.
Technology driven transitions have a significant impact on companies, industries, and markets. This paper provides insights on preparing and executing effectively during such transitions. It analyzes the transition that the automotive industry is going through that has major risks and outsized opportunities. Two areas have been emphasized – operationalizing long-range planning and adapting structurally to market demand signals. The author outlines unique capabilities that Zyom specializes in to help companies navigate the complex and risky road ahead.
Technology driven transitions
All transitions, especially new technology-driven transitions, that are global in its reach, result in big risks, even for strong incumbents in the industry impacted by the change. Most of the risks are unknown, before the technology achieves suitable level of maturity for larger scale usage. Some can be existential risks.
However, in most cases, these transitions result in significant opportunities to create and carve out extremely large, market opportunities. A sizeable subset of these transitions have an outsized impact in altering user/consumer behavior in profound ways.
While there is a large body of work about the disruptive impact of new technology on companies and industries impacted by the change, most of it is focused on higher level competitive strategy.
While this is an important line of investigation, it suffers from a major shortcoming.
Far too often companies fall short in the vital area of executing – making their strategy operational. And this problem plagues larger incumbents who get knocked off their perch by these transitions, and strong, mid-size competitors alike.
This paper is a study of one of the most critical transitions that is ongoing in the automotive industry – from polluting ICE cars to lower-carbon alternatives – which is yet in its early innings. It offers new ideas and approaches for operations management to prepare, plan and execute during these transitions effectively and efficiently.
The points surfaced here can be utilized by cross-functional operations leadership (product, operations – sales and supply ops, and operational finance) for any other technology-led, large-scale transitions that are emerging or ongoing in any physical products industry.
Automotive – A massive, bumpy transition, a looming imperative
The automotive industry is in the middle of a massive transition. This has resulted in big risks, and sky-high opportunities.
A massive, seemingly irreversibletransition[1] is going on in the Automotive industry, starting with the large, well-capitalized economies– from legacy IC[2] Engines to Battery EV (or EV [3]) and other alternative energy auto options (hybrid, hydrogen, etc.), due to a confluence of many forces:
Adverse impact of fossil fuels on humanity’s well-being on a large scale – pollution, air-quality, grave hazards to ecologies and humans caused by oil extraction companies and ICE autos, which is also a key ingredient causing extreme climate uncertainty. In 2020, the transportation sector alone accounted for about 20 percent of global greenhouse-gas emissions (source: McKinsey, McKinsey__Study-on_the-future-of-mobility).
Resulting government regulations, along with controls, incentives and creative policies put in place by some of the largest global economy players and GHG[4] emitters – from EU to US to China, Australia, India, among many others.
Availability of suitable technologies & materials – Although technologies are still far from optimal – for instance, EV battery materials resulting in more mining, potential future conflict between energy and food supply chain needs[5], greater dependence on energy from utilities, most of which are still dependent on carbon-intensive/dirty carbon sources, the supply-side of these materials have scaled up significantly over the last 5+ years, so has driving range and charging availability[6].
Shift with bruising bumps in market demand[7] towards EV (and other low-carbon options), and away from the traditional ICE auto, despite higher prices of EVs/ alternatives versus ICE autos[8], near term demand slowdown notwithstanding.
A major transformation underway among legacy ICE auto-makers as they slowly but surely wake up to the serious competitive, potentially existential threats posed by the electric transition, as a means to cut emissions, the technologically smarter pure-play EV companies making it, and the rising public awareness around climate impact of ICE autos. Leading, pure-play EV makers, with their smarts in clean-sheet design in hardware, software, its integrated functioning, zero legacy operations baggage and consumer-friendly direct sales model, appear to have a sizeable lead over the legacy makers in engineering and manufacturing of EVs; as Jim Farley, CEO of Ford candidly admitted [9], not too long ago.
Lower complexity Bill of Materials (BOM), a transformed product – Despite challenges in manufacturing[10] EVs at scale and attaining suitable margins, from a BOM standpoint, the EV is a simpler, and in key respects, a superior product too – beyond being fossil fuel-free. In addition, with the EV, the auto is going through a radical transformation – from a mechanicals-heavy to an electronics and software heavy product.
Very Bumpy Transition guaranteed– As this paper was going to press (early January 2024) the drumbeat of downbeat and dismal news from the EV industry reached a high pitch. Demand for EVs appears to be stalling in the near term, down substantially from the rising trend that was emerging over the last 2-3 years (footnote#1). Legacy ICE automakers who had previously made bold commitments to allocate substantial resources to EV capacity, are reducing their EV commitments, often substantially (GM, Ford, etc.).
A sizeable number of legacy ICE automakers are instead cranking out more hybrids at the expense of EV’s to achieve their reduction goals.
The underlying EV technologies, and other ICE alternatives need to evolve and maturesignificantly and swiftly. Yet, it is clear to the informed consumer, especially those that can afford it, that they do not need a power station burning polluting fuel under the hood as they go from point A to B – the case with IC engines. For legacy ICE auto companies with significant direct emissions[11], transition to EVs and other low-carbon options, is a looming imperative.
In fact, this can be stated with a high degree of confidence[12] –for all ICE automakers, except very few, who started on their learning curve of EV operations a few years ago, the transition to a cleaner automotive technology, is an existential threat, as the inevitable shakeout takes place.
Planning & Preparing for the transition
So, how should the auto industry prepare itself for this transition – both the traditional ICE automakers and their younger EV rivals? Following are 2 key takeaways based on Zyom’s research and direct industry experiences[13] even if transitions were not of the same magnitude:
Operationalize Long Range (5+ years) Planning – From operational standpoint, most long-range business planning cycles range from 12 to 24-month (hi-tech, electronics intensive industries).
In many industries, the range stretched out much more due to the choking of supply chains during the recent covid-19 pandemic, ongoing significant restructuring & retooling of supply chains, and altered goods flows due to strategic concerns over potential or actual lost capacity and resources
These stemmed primarily from the unpredictable conflicts impacting several regions – namely, Russia’s ongoing attacks on Ukraine (harness makers), China’s aggressive territorial postures towards Taiwan (semiconductor chips, rare earth/ other key EV raw materials), the Israel-Hamas war (OPEC majors’ region).
Our investigations indicate a longer time range planning process is required.
No, long-range planning cannot eliminate uncertainties caused by such unpredictable events. This leaves a big question – how is this (long-range planning) different from Business Continuity Planning?
The key word here is ‘operationalize.’
Most long-range plans are basically of limited use, if not futile, since many of the key leaders who design and implement it – manufacturing and supply chain, sales, product-line management – realize, that planning for anything beyond 2 to 3 quarters, in rapidly changing, technology change intensive industries – is, at best a guestimate, in the worst case an output of little use – because plans beyond 2+ quarters are perishable, and it’s a fool’s errand to try and bring it back to life, or worse – modify those to utilize it in running operations.
Operationalize implies the ability of tying these long-range plans with plans in the tactical horizon (2-6 quarters out), ensuring these are not only tied with overall strategy, but also considers likelydisruptions along various operating links, nodes, peoples, and evolving economics – macro and micro – across business cycles.
This is where a complete commitment to cross-functional knowledge, and capability sharing and collaborative planning is required across supply chain partners (product enterprise – auto OEMs, in this case, and their key suppliers – Tier1, some Tier2, and others upstream), and across functions within the auto OEMs (Product Line Managers, Sales and Manufacturing/ Supply Chain operations, and Cost/Value engineering).
Shrinking Window of opportunity – Legacy automakers, in the US and EU especially, need to make concerted efforts in operational long-range planning, since their “window of opportunity” to stay competitive maybe smaller than they think (case in point – Labor strife at the Big-Three[14] in the US resulting in a 25% labor cost increase[15], EU mandates for 100% EV production effective 2035).
Pure play EV manufacturers in the US, EU and Asia, except a few[16], may also have a rough road ahead, with a smaller and potentially shrinking “window of opportunity” versus legacy, ICE vehicle makers, due to the intrinsic capital-intensive nature of the industry (requires significant capital investment up front in plant and equipment), and extrinsic factors such as – intensifying competition from current EV leaders (Tesla world-wide, BYD of China), structural debt-intensive nature of recent macro-economic revivals (post covid-19 pandemic) – elevated inflation and higher interest rates, which has dampened EV demand based on the latest data (footnote#1). Large EV markets, such as China, are facing severe slowdown in demand.
In addition, unpredictable geo-political trade impasse (e.g., US versus China, EU v. China) also threatens to severely constrain critical raw-material inputs, and choke EV trade volumes.
Governments & the long view – A key contributor to long-range planning are governments and their productive engagement with new industries. In large, well-capitalized economies that are relatively free of state-control (the US, EU, Japan), private enterprises are driving most of the innovation, with some government support (example, loans to EV, battery and charging infrastructure makers). Automakers in the US, EU and mature economies that are currently leading EV adoption have benefited from this.
Chinese automakers’ selling price for EV is similar to the prices European automakers sell ICE cars for!
However, these automakers will find their hands tied as aggressive overseas competition heats up. Case in point – Chinese automakers’ selling price for EV is similar[17] to the prices European automakers sell ICE cars for!
A chunk of this anomaly can be attributed to the command-and-control structure of China’s (and similar) economies which enables national “champions.” However, governments and industry leaders in the US, EU and other free economies will be putting the economic success of their auto industries at grave risk without digging deeper.
What has benefited such an anomalous success in economies such as China, is a very long planning horizon[18] (10+ years). This has enabled companies in these economies to scale, often quite fast, capture a significant share of the nation’s market, and subsequently expand globally as well. Case in point – BYD, which started as a battery supplier in the late 1990s to mobile phone makers, and eventually expanded into making EVs. As of Q4, 2024, BYD is the largest EV automaker world-wide, having recently surpassed Tesla.
Market Demand Signals – Big changes are afoot in this area, especially driven by the pure-play EV automakers. From a channel only centered (i.e., dealership only) demand generation and fulfillment model, to an OEM driven demand-gen and fulfillment model (via OEM showrooms, e-commerce website, etc.). This has profound implications for the OEM, and its supply chain, despite resistance to move away from the dealership model by large players[19].
The new model lends itself well to a BTO (build to order), or CTO (configure to order) model of managing manufacturing supply chains. This can be a significant game-changer for the auto industry. Like many other channel-intensive industries[20], auto industry has traditionally suffered from excessive supply clogging in downstream supply chain nodes – at dealers and distributors, who are the preferred, and often the only way, to fulfill end-customer demand.
The new model lends itself well to a BTO (build to order), or CTO (configure to order) model of managing manufacturing supply chains; this can be a significant game-changer for the auto industry
With the ability to switch to a more BTO or CTO centric model, and tightly aligning or cutting out the intermediary (dealership channel), demand generation and, end-to-end demand through supply planning, manufacturing execution and final customer order fulfillment is now the purview of the OEM. This will lead to much better visibility and better controls over finished goods stocks, long lead-time parts and sub-assemblies’ supply, faster feedback loops for corrective actions to be taken to right-size inventory, and get closer to the product mix that is selling in the market.
In addition, the virtuous cycle of rapid feedback on product options (options’ desired/ not desired/ hated) and rapid flow of product gaps/issues into product engineering, will provide a clearer line of sight on customer needs versus automakers’ aspirations.
With a clearer picture of demand, the industry can shift away from ‘Build to Forecast’ and all its ills (including, working capital tied up in dealer inventory) towards a primarily BTO/ CTO approach, and its virtuous cycle (lower inventory, better fulfillment, better understanding of customers’ product preferences, and perceptions).
Any residual capacity, if available at the end of a plan period (quarterly, every 6-months), can be used to build products that are in demand, or need fewer price-reduction type actions to move the inventory downstream from “stocking locations” to customers, or the capacity can be held back for vital upgrades and maintenance, or just planned downtime (theory of constraints and its virtues). In fact, even with rising demand, there may be a need for proactiveresidual capacity planning (à la inverse of “yield management” used in the airline industry).
even with rising demand, there may be a need for proactive residual capacity planning (à la inverse of “yield management” used in the airline industry)
A singular opportunity – Getting this transition right
History has some datapoints for us. At the turn of the last century (1880s to 1920s) the personal mobility industry in the US was going through one such major change (from horse drawn carriages to cars). From over 200 automakers, the field collapsed to eventually 3.
How did the last 15-20 dynamic automakers fall, leaving the field to the Big Three?
Better marketing, better manufacturing processes (Ford’s mass-production lines), better mix management (no options or very few), others? That maybe a topic for industrial historians to dive into. What is clear is that the Big Three were able to scale up their production effectively, meet the demand of a growing base of new consumers (sales, re-fueling and service), and do it all while keeping price points attractive, bringing increasing number of customers into the fold, and achieving and maintaining healthy profits.
Today (circa early 2024 and over the next 5-7 years), both legacy ICE automakers and pure-play EV makers face big challenges as they navigate this significant industry-wide transition.
Neither the incumbent ICE automakers, nor the disrupting EV makers have an unsurmountable advantage over the other, although select EV makers – Tesla and BYD – appear better placed.
This transition, like any transition of this magnitude, promises to be full of peril and near-term pain. However, there is an extremely outsized opportunity of industry-wide leadership for those that ‘survive’ this transition, achieve target unit economics to attain profitability, are able to sustain profitable operations, and the many unforeseen and un-plannable macro-economic and industry-wide disruptions that may surface, and throw the transition off course.
The grand prize is to be in the Big “x” (EV) makers (“x” being the unknown – will it be 3 in cars? 3 in pickups? 3 among truck makers, etc.). These handful will dominate the electrified (or alternate energy) vehicle future.
Automakers that effectively utilize these ideas, stay laser focused on mid and long-term profitability (2 to 10+ years), and ensure that in all major decisions they stay the course on ‘real sustainability,’ will ensure that they remain a force to reckon with for years, potentially decades to come. They will also play a vital role in the world’s safe transition towards net-zero and net positive environmental goals.
For the road ahead – A unique opportunity to gain an operational advantage
The transition and resulting changes expected in the automotive industry globally over the next 2-10 years will be complex and fraught with risks. This transition will be anything but linear (maybe, sizeable transition from ICE to hybrids versus EVs comes first, EVs later).
Both legacy ICE automakers and EV pure-plays – will need to become more cost competitive, while doing a delicate balancing act – simultaneously ramping up volumes of some products (EVs, hybrids, etc.) and throttling down on other legacy ICE products, while meeting a myriad of other critical needs (investors, regulators, competitors, public and others).
This is a time for companies to lean on specialists.
Zyom specializes in providing the most cost competitive operations management support system that has directly supported companies in industries going through transitions. How?
Zyom specializes in providing the most cost competitive operations management support system that has directly supported companies in industries going through transitions
By helping companies effectively utilize their cross functional operations teams, starting with manufacturing and supply chain operations, pinpointing specific areas of operational improvement, and implementing the needed capability in full. In many cases, this has resulted in a significant operating advantage – making companies among the most cost competitive in their industry, while balancing the needs of being demand responsive with progressively increasing volumes.
Industry leading results – briefly
Utilizing Zyom’s capabilities, a networking infrastructure provider in a new vibrant industry segment, achieved 10x the scale (volume shipped) within 4+ years, while achieving and staying profitable, and becoming an industry benchmark for cost-competitiveness in the process.
A Fortune 100 electronics industry leader radically redesigned their cross-functional processes utilizing Zyom to minimize inventory related costs, in response to a single product transition resulting from new technologies that had cost the company $10s[21] Million.
Ready to get into the Driver’s seat?
What makes the set of capabilities that Zyom equips its customers with unique are its innovations in these distinct areas:
Closed loop operational planning and execution
Product and Operations cost optimization
Smart collaboration across functions and value networks
The capability set delivered is based on the specific transitions and changes the companies are planning for, or faced with, yet general purpose to evolve as needs evolve. Utilizing these, Automotive and other physical product companies can focus on specific, tailored capabilities to attain, maintain, or sustain profitable operations.
Ready to gain an operating advantage, or just get a copy of the Paper from which the above information is extracted, please reach out to the author via comments, or via https://www.zyom.com/contact.php .
Automotive companies, seeking profitability at scale, will gain a unique operating advantage, while navigating the ongoing transition – the twists and turns in the road ahead.
[1] As an early draft of paper went to press (Dec, 2023), news was pouring in about a potential slowdown in EV adoption in the US; click here for more: Why America’s Car Buyers Are Rethinking EVs, Bloomberg, Jan 2024
[2] IC = Internal combustion (as in IC Engine) or fuel-burning engines
[3] EV (or BEV) = Electric Vehicle (aka, Battery Electric Vehicles)
[4] GHG = greenhouse gases; the ones that trap heat causing climatic temperature rise over time
[20] Parallels with the channel-inventory intensive nature of Computing (PC) industry of 1990s are worth noting; Dell raced ahead utilizing a ‘Dell-direct’ model leaving larger incumbents – HP (Compaq) and IBM behind
As the adverse impact of climate uncertainty (hotter, wetter, stormier, etc.) start having a material impact on businesses, product manufacturing and distributing companies will be forced to define and act on ESG (Environmental Social & Governance) commitments. This article introduces ESG, and lays out some of the core capabilities needed to effectively implement ESG in supply chains.
As the adverse impact of climate uncertainty (hotter, wetter, stormier, etc.) start having a material impact on businesses, board rooms across industries, will be forced to define and act on ESG (Environmental Social & Governance) commitments.
Product manufacturing and distributing companies of a meaningful size, will have to make parts of ESG a critical component of their business continuity plan, and show they can act on it, within 7 to 10 years.
This article introduces ESG, and lays out some of the capabilities needed off the bat, to effectively implement ESG in supply chains.
First, what is ESG?
Depending on where your company is in its journey, ESG can be:
Another set of (Reporting) demands, (another blah blah..)
A framework to design and plan for ESG, or
A ‘Movement’ towards
Ensuring that companies operate in an:
Environmentally sustainable,
socially equitable,
fair, lawful & balanced way (shareholders, employees, and a healthy planet’s needs)
With a key goal of realizing the environmental & social requirements, while ensuring governance expected, and preventing greenwashing (basically – cheating).
Why is this important?
to protect the planet’s natural resources, prevent over-consumption without adequate replenishment or mitigation
to safeguard people directly (and other life forms indirectly), across value chains, and
to support well-being of communities and societies they operate in (equitably)
Ensuringthat companies continue to supply their products and services, in a timely and cost-effective manner
So, what is the issue?
This looks like a win, win, win for all – end customers, product companies, their suppliers (some additional work & costs involved), governments and civic societies.
So, what possibly could be the issue with ESG?
Far too much emphasis is currently being given to Reporting, versusoperatingin a better manner with respect to real ESG needs.
Necessary but not Adequate – ESG reporting useful, but limiting
ESG data gathering is a critical first step.
Based on Zyom’s direct experience implementing supply chain wide solutions for better understood non-ESG data, across value chain tiers, this is a most demanding exercise, and will be harder given the limited awareness about ESG needs in manufacturing supply chains.
ESGScoring will be important for implementation success. The challenges – the extremely unique needs of each industry, and a lack of sources of quality data.
ESG Reporting, useful at first glance, is inadequate and insufficient to meet the needs of ESG guided operations. In fact, the reporting emphasis can be limiting, and will dilute focus.
What are the real ESG operating needs?
How to get ahead of the ESG “regulation curve”?
Especially in terms of designing and defining supply chain partnerships before the regulation hammer falls. This is important for both key and non-key manufacturing, distribution & logistics partners.
Industry context-specific ESG metrics and processes must be agreed to with supply partners at the get go, ensuring, at a minimum:
Completeness and accuracy of data required to determine ESG risks.
Agreement on timely ‘shipment’ of supporting ESG data by supply partners
Alignment on ESG Metrics & Monitoring process
Process to periodically align on ESG (quarterly, or frequent, e.g., event driven)
2. How to operate ESG ‘aware’ supply chains?
Once the above are in place, operating ESG “aware” supply chains will mean answering these quickly:
What are ‘out of bound’ ESG events? How to identify such events fast?
What ‘corrective actions’ need to be taken in advance of such ESG events? Base it on products impacted, supply network’s “segment” impacted, etc.
How to monitor and ensure the corrective action had its desired impact?
What are additional costs in case of corrective action?
While some of these appear familiar territory for supply chain operators, some are not. What new capabilities will be needed? Do not go it alone.
Profitability + Sustainability (& ESG needs) – the only way
All of the above will be moot if product supply chains struggle to operate profitably.
For a company to focus in this crucial area of ESG, they must be profitable first, or show a meaningful path to near-term profitability. Only profitable companies will be on solid ground to launch their sustainability efforts from.
Unprofitable companies, or those with a lop-sided dependence on government (or investor’s) money, will most likely, be wiped out, or put another way–
will be toast, making ESG targets even more elusive.
Acknowledgement: Mr. Devesh Sinha, Langan, provided valuable inputs to this article
Disclaimer: No Generative AI was used for composing any of the writeups here (including this one), nor for any data gathering; At this point of time, there is no plan to use Generative AI to generate any content on this site. Readers will be informed in advance if this changes.
Profitability has again taken center-stage when evaluating the near-term operational performance of Product companies, and their long-term prospects.
This article highlights some of our learnings & experiences regarding –
What are the different pathways to profitability, or growing profits?
What to watch out for?
These learnings are from the vantage point of Operations leadership, and for all who lead, or support cross-functional operations.
In the current backdrop of an ongoing pandemic, persistent inflation, the corrective actions being taken by central banks, its confounding impact and a widespread feeling of uncertainty, Profitability has taken center-stage again when evaluating the near and longer-term operational performance of Product companies.
This article highlights some of our experiences and learnings to answer the questions – What are the different pathways to profitability, or growing profits (for companies that have achieved profitability)?
What to watch out for?
These learnings are for Operations teams, their leadership and all leading or supporting cross-functional operations (Finance, IT, Engineering).
Putting Profitability on the back-burner will burn your enterprise
Companies that pursue ‘growth only’ approach, without careful attention to “profitable growth”, risk losing sight of the insidious effects of factors that will erode eventual economic value of the enterprise. How? Growth, especially growth at a breakneck speed* invariably leads to poor quality of attention being paid to anomalies in ‘cost of growth’. Growing costs creep in even when a company grows in line with plans. With unplanned growth, growing costs become bad news that arrives too late, eventually derailing the path to profitability for larger and mid-size product companies alike.
A Company that loses their ‘path to profitability’ (including sustaining their profits), loses the chance to maximize its own value and provide maximum value to customers. Key questions for company leaders –
As you make Plans, especially those with longer-range impact (e.g., adding factory or warehouse capacity), do you have a clear picture of its impact – on existing customers, on profitability?
What if (.. list any of the many changes here) happens?
* Seen in the pandemic times circa 2020-early 2022 in a subset of IT goods and e-commerce industry
Manufacturing & Supply Chain Operations teams are core to any product company’s mid to long-term survival and profitability; their evolving mandate
Over the last 2+ decades, this author has observed the slow, almost inexorable slide downwards, of the role of “Manufacturing and Supply Chain Operations” teams in companies that design, make and ship branded products – across many industries (from Hi-tech electronics to consumer appliances, to name a few).
As ‘outsourced manufacturing’ in several industries, stripped away the ‘physical assets’ (machines, tools, materials) that Operations teams were responsible for, operations teams shrank – often, with good reason. Unfortunately, the Operations function’s importance as a strategic partner of the CEO, as a part of the executive team, shrunk too, overwhelmingly – except, in those organizations where the Operations leaders were strong change influencers and facilitators, and the CEOs and other influential leaders were clear about it. Clear about the fact that – Operations team and their leaders arecore to the company’s success – whether manufacturing is outsourced or not.
This phenomenon was upended by the global pandemic starting circa early 2020, as factories, materials needed, ports, and people working these, froze up, and buckled under their weight of the pandemic.
Only those companies can serve growing markets profitably in the longer term, when key leaders and the CEO are clear that Operations team and their leaders are core to the company’s success – whether manufacturing is outsourced or not, and the Operations mandate will need to evolve
It appears that this, among other reasons, have resulted in a shift, which is yet a ‘work in progress’. Indeed, Operations teams are now playing key roles at companies, at least among stronger ones, often in new, strategic settings – in some cases, the Operations leaders getting invited to share their “supply chain insights” in quarterly, financial, market-facing calls, alongside the CEO and CFO.
This is the right time for Senior leadership at Product companies to work closely with their Operations leadership team and build out the necessary competencies and capabilities needed, so they are not caught flat-footed, and new ways of operating are developed and implemented, as the pandemic persists, and other major “supply constraining” events take place (war, weather-related/ climate-change induced disasters, and their aftermath, etc.), some of which may seem deceptively “further out”. Key question –
What key Operations capabilities and competencies are needed now?
How will the Operations function evolve – Can Ops step outside of the ‘cost control’ function (traditionally, a “comfort zone”), and contribute directly towards the ‘profitability’ function?
How can Operations step outside of the ‘cost control’ function (traditionally, a “comfort zone”), and contribute directly towards the ‘profitability’ function?
We have seen transformative results when Operations leaders have such a mandate. However, a ‘mind-shift’ is needed.
For example, during a time when one of the largest integrated Steel plants in India, Tata Steel, was facing severe input constraints, our founding advisor’s work to optimize operations directly helped expand profit contribution even as total output volume went down, resulting in a radical rethink of how to manage operations (International award-winning work by Dr. Gopal P. Sinha**).
A word of caution here – Do not go back to the old ways – i.e., diminished attention to the Operations function when these “economic clouds” start clearing up and “headwinds” to Revenue growth diminish.
Deliberate & Intelligent Collaboration is the only way for any company to succeed
While this is true for enterprises of any size, irrespective of their relative position in their industry, it is especially true for younger (growing startups and scale-ups) and mid-size companies that have to innovate and grow their products and offerings. “Collaboration” with a capital “C” can result in many intuitive and non-intuitive benefits. Highlighted below is one –
Unexpected “value” and “insights” from suppliers and their products, especially those with a “collaborative” approach. Credible smaller providers (i.e., with proven success), may have a lot more to offer than larger providers, since “innovate and execute” is core to their survival and growth.
For example, in one case, a Procurement executive at a growing, mid-size product enterprise was “surprised” how a system (provided by Zyom) significantly improved collaboration with Finance, reducing time in hand-offs between Ops and Finance, and eliminating errors which resulted in higher supply costs, in addition to other primary benefits. Question –
Have you explored any credible, new ideas in managing cost, and improving profitability with all your suppliers?
Supply driven “Inflation” needs a different mindset & tools
As the US, Europe, Japan and most free-market economies grapple with the most severe inflation in the last 4+ decades, it is an imperative to approach this ‘inflation’ cycle with a different mindset, in terms of operational execution.
In this case, persistent inflation was triggered largely by a once in a 100-year pandemic resulting in massive, cascading disruptions to global supply chains, choking supply severely (demand largely intact after the initial shock), the resulting policies (government, central banks, even companies – inducing more demand), subsequent uneven return to normalcy (China, an important global player, has entered a dangerous phase 2 of the pandemic, as of December 2022). Geopolitical unease between the US and China, the attack on Ukraine by Russia, has forced speedy rethinking of supply sources, making matters very difficult for those operating global supply chains.
The Chief of Operations always had a dual mandate – Right amount of flexibility at an optimal cost, which are at odds with each other.
Flexibility implies flexibility in the manufacturing and supply network – capacity, inventory, etc. Costs include all product and operational costs that impact cost of goods sold.
Increased flexibility directly leads to higher costs, often a step-function increase.
In light of the evolving global pandemic and ongoing supply constraints (though, getting better), key questions for Operations leaders and the CFO are –
What specific decisions can Operations directly support to address the profitability squeeze (due to inflation)? How? (Latter will require new tools)
What key new metrics are needed? What traditional metric/s needs to be revisited?
What specific decisions can Operations directly support to address the profitability squeeze (due to inflation)? How?
Stop looking for (system enabled) answers in the wrong places
To navigate successfully, in this new, rapidly changing environment requires a Rethink – especially regarding process,data and analysis support needed by cross-functional Operations teams. Do not expect a zero-risk mindset to work if you are trying bring on-board any new capabilities that your enterprise currently needs, or maynot know that it needs. The right partner can help uncover these ‘unknown needs’. And casting off this zero-risk mindset is a prerequisite to drive profitable operations.
Too many companies scale operations to reach a certain ‘threshold’ volume, only to decide, without adequate due-diligence, that their growth is being constrained because their existing ERP system cannot “scale up”, and that they need ‘add on’ ERP capabilities from the incumbent, or (worse) start implementing a new ERP system.
This is a classic “integrated-solution out of the box” logical fallacy which is played upon by entrenched incumbent providers (especially ERP software provider and their cohorts). Why is this a fallacy?
This is a classic “integrated-solution out of the box” logical fallacy which is played upon by entrenched incumbent providers (especially ERP software provider and their cohorts).
Most ERP[1] systems have been laggards, even to date (2021 – 2022), in vital areas such as “Planning”, especially context-rich planning, which, ironically, is what the ‘P’ in ERP is supposed to stand for.
Some ERP suppliers have plugged their holes partly with acquisitions. Despite this, they struggle and make their customers struggle, under the unending burden of their long, expensive implementation cycles, often, even for basic ERP (Accounting/ General Ledger, Inventory) capabilities.
Unfortunately, since risk-aversion in adopting and implementing systems runs high among decision influencers, the malaise persists. “No-one got fired for buying XYZ” being the prevalent mindset (replace XYZ with any of the afore-referenced providers) – a system largely built to be a repository of transactional data, is stretched and patched to “add on” other capabilities – in the name of “integrated solution”, only to fall woefully short.
Looked at another way- a largely “commodity” software with “General Ledger/ Accounting” as its core, has been stretched and bloated to be utilized for highly specialized and often strategic needs, without having qualifying capabilities or people to support the extensions (at the ERP provider). This is damaging in the short and the long run for the product enterprises deploying these, given the predictable longevity of these implementations.
The questions to ask internally is –
Can we wait 2-3 years to get these critical operations management capabilities***? And incur the costs (of waiting)?
Do we understand our “systems” decision blind spots and biases?
Are we even looking at the right type of system solution or provider partner?
*** 2-3 years based on actual data from Zyom. less than 50% probability of expected outcome in areas of planning, context-specific analytics, operations execution
On Leadership, in brief
With a seasoned Operations leader at the helm, who has seen a few operating seasons, and knows about “why” and “what” of specialized Operations Management systems, these de-risking debacles (“let’s do it all in our ERP system modules”) are pre-empted – i.e., cognitive biases and fallacies mentioned before, avoided or overcome. However, the very companies that need such leaders – growing mid-size companies or younger, faster paced scale-ups – do not have access to such leaders in a timely manner.
The question for the CEO and senior leadership team is:
Do we have a seasoned Operations leader who not only understands the business needs (what’s needed in the supply chain, team) but also recognizes the unique data and system enablement needs of operations? If not – identify a suitable partner (internally, and externally).
Do they know (or have adequate support to identify) what types of software systems outside of ERP are available and effective to support Operations teams?
Implementation is It.
Perhaps this is the most important learning of all.
In fact, this is where most worthy operational change goals can bite the dust, especially if “lets extend the (heck out of out) ERP system” mindset persists, when considering system enablers. This is where specialized providers (such as Zyom) create a better world for Product companies and its system users, by being laser focused on Implementation, no matter what. This is the only way meaningful changes are implemented and benefits realized.
Once the initial “visioning” has happened, the hard and soft requirements have to be “implemented”, whether in changes to processes, or to software systems enabling the process change. This is where many, if not most, ambitious digital enablement efforts fall way short. Digital transformation remains a distant pipe dream.
A sizeable volume of words won’t be enough to cover key learnings about such system implementations and how it is effectively integrated into processes (potentially, a future post). Needless to say, to attain/sustain/grow profitability, a new way is required – new collaborations and potentially new systems and tools.
.. to attain/sustain/grow profitability, a new way is required – new collaborations and potentially new systems and tools
Because, this is where the rubber hits the road, and things can go flat and flounder, or zoom forward, even soar.
With a new 2023 starting, this is the right time to sketch out such a change, talk to such a partner.
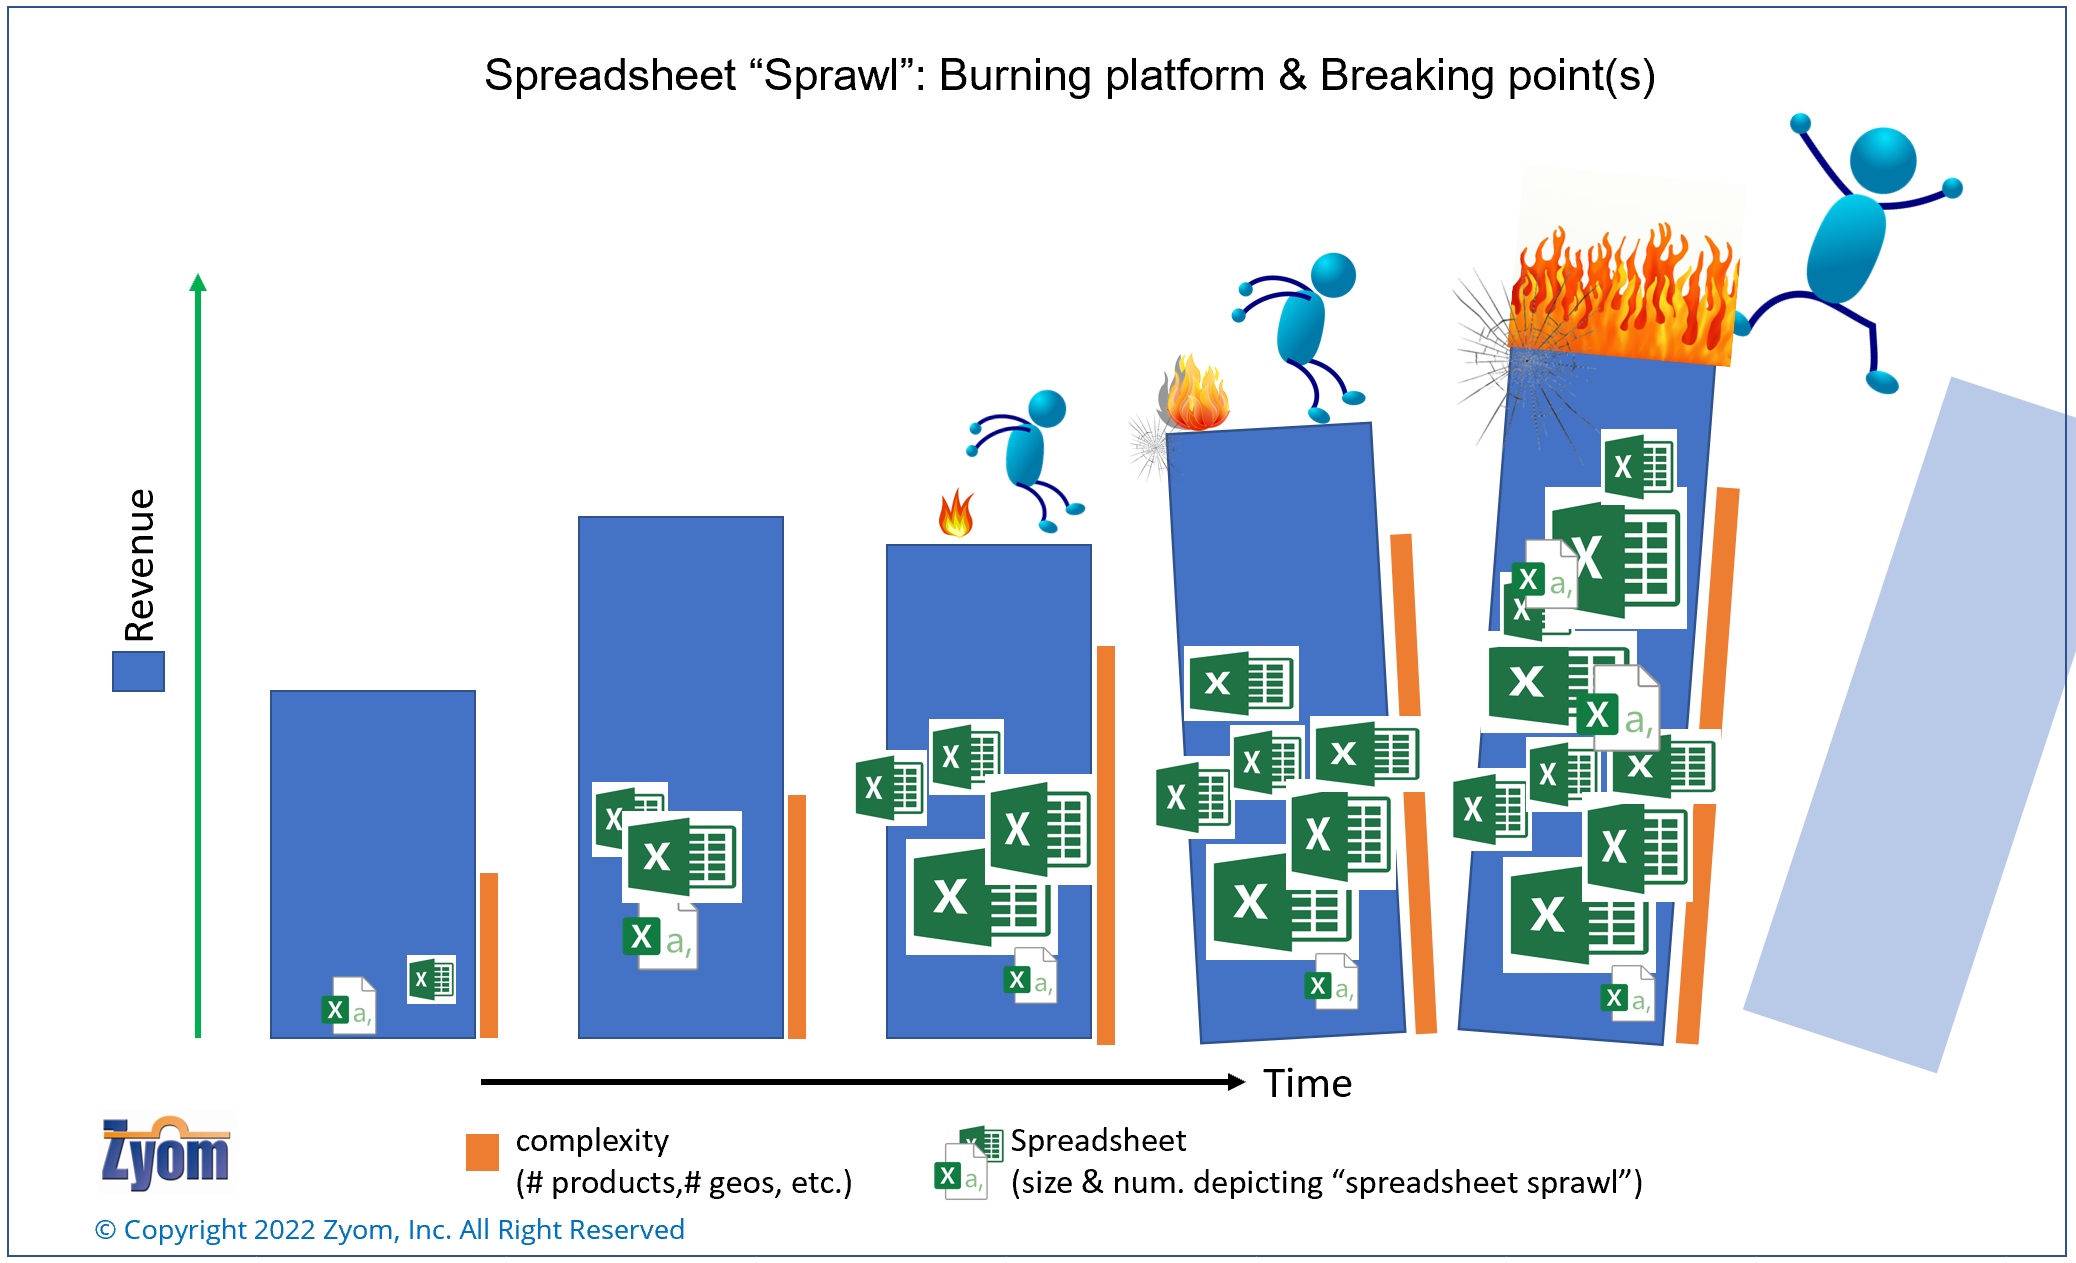
As companies grow, they face a different type of ‘growing pain’. Growing number and size of spreadsheets managing critical operational data, plans, decisions and more. We call this “spreadsheet sprawl”. Users and senior operations managers across functions have to be careful that this growth – in spreadsheets – is managed carefully. Left unchecked, this can lead to a breaking point after which the spreadsheets that previously supported operations can become a ‘burning platform’ – leading to severe unproductivity of key team members (planners, procurement specialists, managers) and far worse – direct, detrimental impact to the company’s operations. This Implementation Note draws from the Zyom team’s experiences to outline some early signs that such a breaking point is fast approaching, and what potential corrective action should be taken. And importantly, which remedial actions can make things worse.
Implementation Notes
As Supply constraints continue to wear down Operations teams across industries and the world –the last two years due to the pandemic, and recently with the invasion of Ukraine (in some industries), the last thing on Operations and senior leaders’ mind is the multifarious “spreadsheets” used by cross-functional teams (Supply Operations, Sales, Finance). Yet, our experiences have shown us that for companies that are growing, moderately or geometrically, spreadsheets used in operations are precisely where you should train your team’s attention to, for some key, quick wins.
“Burning Platform” & the ‘breaking point(s)’
In any growing product company spreadsheets are used, especially in the early, tentative stages of growth. Left unchecked, the number and size of spreadsheets start growing rapidly (we call this “spreadsheet sprawl”), often reaching a breaking point at which point it can quickly become a “burning platform”[1].
Why “burning platform”? Excessive reliance on spreadsheets beyond a critical “ point” starts negatively impacting the immediate users (planners, procurement), and downstream management users who rely on data for planning and decision-making. That’s not all. There can be more serious knock-on effects to a company’s operations[2] if spreadsheets are not reined in at the right time.
This note focuses on identifying some key* symptoms and early signs that your company maybe close to the breaking point of spreadsheet sprawl, and course-correction is needed quickly to avoid potential operational disruptions. This is also a cautionary tale for leaders in enterprises (Sales, Operations, even the COO) that using overextended spreadsheets is one of the ‘growing pains’ that you want to nip in the bud.
This is also a cautionary tale for leaders in enterprises (Sales, Operations, even the COO) that using overextended spreadsheets is one of the ‘growing pains’ that you want to nip in the bud.
* for a comprehensive list please reach post a comment or reach out to Zyom (contactus@zyom.com)
how companies approach the spreadsheet “sprawl” Breaking point
Large, Functionality “heavy” spreadsheets that keep growing – Spreadsheets that are increasingly consuming more time – of cross-functional Planning and Execution team, especially those responsible for Demand Planning & Supply Chain operations functions, and space – on computer, network drives, cloud storage, etc. Sometimes these spreadsheets can even slow down users’ computers. Questions to ask: Is it taking a long time for your spreadsheets to load up on your machine (including, machine becomes non-responsive)?
Are you spending a lot of time making sure spreadsheets don’t ‘break’? For instance – fixing formulas/ macros so spreadsheets do not break down when making changes (e.g., adding new products)? If this is the case you could be flirting with the breaking point of severe “spreadsheet sprawl”.
Top Analysts (Planners, et al) “running out of time” frequently when trying to get their jobs done – A key feature of this early warning sign is – a lot of time spent “maintaining spreadsheets” and too little time to conduct “analysis” on the numbers. As a younger product company, you can afford to get going with spreadsheets for critical operations data, while the company is still ramping up (number of products sold, the number of sales geographies, etc.). However, there comes a time when a lot of time is being spent “setting up” the spreadsheets even before any analysis, planning or results (e.g., reports/ charts) can be generated.
For example, if you were to identify a discrete ‘operations’ job’ – say, ‘setting up all SKUs/ FG items’ to conduct supply planning for a new planning period, and it takes you more than 30% of the total time in setting up the spreadsheets, versus conducting the analysis/ generating plans , other key outputs, then it may be time to let go of the spreadsheets and knock on your leader’s door.
The actual % number may vary depending on your growth trajectory, and organizational + behavioral issues. Issues such as – a strong operations sponsor, a reasonable budget for operations automation, how secure users feel on their jobs (e.g., “as a ‘top planner’ will it appear that I’m slacking off? Should I put in another 3-4 hours to get this done, and not worry about bringing this issue up?).
Users “holding” on to their spreadsheets; IT team doesn’t want to “touch” the spreadsheets (“10-foot pole” rule) – Then there is the case of getting attached to spreadsheets. Users (on-the-ground planners, and curiously, even supervisors) may not feel like letting go of the spreadsheets. Perhaps due to the number of hours invested in their spreadsheet (or, number of companies traversed with those), and all the while it has stood them in good stead[3]. So, why toss it now? Ideally, they should run 2 sniff-tests. No, not someone else trying to “use” their spreadsheets, and resultant feedback. Here are the two:
Ask a senior/supervisor if they know a better way (or tool) – Experienced Operations leaders can help assess if the team is reaching the breaking point. Knowledgeable leaders know that ERP based automation is not the solution, despite the various ways in which ERP makers have “platform-ized” their solutions. Leaders with insight know that specialized planning tools (“Advanced Supply Chain Solutions” etc.) are expensive, and often hard to implement – especially, if offered by ERP-first providers. The best approach is to look for a “capability-specific” solution which is cost effective (industries served, operations models served). Best-of-breed “Planning” solutions are fair alternatives. However, this maybe an expensive route, and not provide flexible capabilities that you need.
Ask IT team member to ‘review’ your spreadsheets – At a small, dynamic company, a senior IT team member shared an anecdote which nails this point- ‘When [Lead Planner] wanted me to ‘take a look’ at their planning spreadsheets, to see if I could help with automation, I felt like saying– “won’t touch it with a 10-foot pole” (tongue in cheek).’ Implying, when the complexity and volume of the spreadsheets (number of sheets in a file, number of spreadsheets, formulas etc.) is enough to deter even the most intrepid IT folks, then you know you are closing in on the ‘breaking point’.
Large (and growing) Spreadsheets shared across functions & partners (suppliers, et al) – When planners/procurement team members in companies that make physical (hardware) products are dropping large and growing spreadsheets into “network drives” or over “MS-SharePoint” or over email (to share with partners outside their enterprise “four-walls”), or doing custom development in Google Sheets, then prudence and our experience shows, these team members are headed the wrong way, accelerating towards, instead of away from the breaking point. It’s time to pause and ask –
Have we (or I) agreed with any of the points above? If you have, then stop.
You maybe be shaving pennies (using spreadsheets) when you can turn on a dime, deliver outputs smart and fast (using a software system) and give your company a lasting operating advantage.
It’s time to quit the spreadsheet(s).
[1] users forced to “jump off” into new tools/ automation without adequate due diligence to assess needs and map to a superior solution
[2] Accuracy of Inventory, matching for Ops finance, among others
[3] There could be other reasons such as jaded in a previous role trying to implement automation which didn’t work
Parts are super critical. For Product companies the sum-total of all parts is what ensures that the product using the part is ready to make and ship.
Many parts shortages can be painful – economically, and what your logo stands for to the markets it serves, and needs to be attended to quickly but carefully.
This article starts with a short story (fiction) based on real life events, of a major planning dilemma – faced at the onset of the pandemic in the auto industry, and weaves its way across Billions of dollars lost in a short period of time by many companies. Not so for a few other industry peers.
Why? What happened?
This article underscores the critical role of operations planning and execution, and highlights key elements that can be learned, and applied quickly to improve the supply chains of parts (components/ sub-assemblies), ensuring uninterrupted supply, no matter what.
Parts, parcels and people – these three words pretty much summarize the biggest and sharpest pain-points that have come in sharp focus as global supply chain convulsions continue in the aftermath of the onset of the covid19 pandemic.
Sometime missing parts can make a hole in your plans to ship product. However, if parts shortages are chronic and unrelenting, it inexorably leads to big holes in a company’s revenue. Left unchecked, it can get quite grim.
This article is focused on Parts and cursorily touches on the “people” aspects.
Parts are super critical. For Product companies the sum-total of all parts is what make the product whole, and ready to make and ship. Parts shortages, especially those that have a big impact across many products are painful – economically, and what your logo stands for to the markets it serves. And it needs to be attended to quickly but carefully.
“A major Planning dilemma”: of wait & wants – A short story, an outsized impact
First let’s start with a story (fictional) based on real-life events. Its Q1, 2020, and the pandemic has hit the world – first landing in a few countries, it soon spreads like a forest fire throughout the world. In its wake, it leaves ports, factories and other nodes and links of the global supply chain frozen out.
Now, let’s hone in on one industry – the Automotive industry – that’s been recently feeling the tailwinds of growing consumer demand.
Jill, (fictitious name) head of Materials (parts, raw materials) Planning and Tier1 Supply, is feeling anxious. She brings this up again and again with her supervisor – the SVP of Operations at AutoMax1 – a traditional automaker (OEM) that’s been turning its fortune around over the last year or so. A simplified graphical representation of an extended supply chain with multiple tiers of supply is shown here for reference (Auto supply chains are extended, multi-tier manufacturing supply chains, excluding distribution-only nodes)
Jill – “..Bottom has fallen out of the demand .. what should we do with the open P.O.s to the Tier1 suppliers?”
After quick deliberations, spreadsheets and even looking at systems, a decision is made.
Managers (across functions) – “Let’s just cancel the orders”.
Jill – “All the open orders, or a few?”
Pause. More discussions. Deliberations.
Managers (with inputs from senior leaders) – “All”
..
All Q1 and a big chunk of Q2, 2020 turns out be worst case scenario for demand, as predicted. Auto industry demand crashes. Other peers of Jill, and the SVP Ops at other car companies largely take similar or same actions. ..
Its late in Q2, 2020, and an anxious Tier 2 chipmaker calls in and pitches a contrarian scenario –
Tier 2 chipmaker – “Demand’s picking up .. it may pick up too fast .. we don’t know yet. Do you want to reorder (your chips)?”
Again, long pause. Jill is not sure. SVP of Ops is torn. Even management is at sea.
Finally, they decide – “no Thanks .. we’ll wait”.
Not all agree, but they are not the assertive voice/s.
..
Its late in Q3, early on in Q4, 2020 and demand is indeed picking up.
Exciting news for AutoMax1 management? Not really.
Jill and SVP of Ops are super anxious. They may have shot themselves on both their feet with their decision a few months ago.
They have already been testing the waters, started communications with the Tier1s and some key Tier2 suppliers – the ones that make the microcontrollers, or get it manufactured by the Foundries. These are the chips that go into nearly everything in their cars.
Suppliers have NO inventory. Nothing meaningful for a very long time – months, probably quarters.
And the foundries are not heeding their (the Tier2’s) calls for help either.
AutoMax1 gets their COO (even the CEO’s ready) on the line with the Foundry chief.
COO – “You’ve gotta help us out .. we need to ramp up and need these chips now.. This can’t wait a week let alone the months that you are quoting us”.
Chip Foundry Chief – “Sorry, we are really super booked. We cannot even fulfill all open orders from (our larger) consumer electronics companies.”
“They came way before you .. placed hard orders, and reserved capacity”. In effect, giant chunks of capacity are now gone.
AutoMax1 COO – “what can you do?”
Foundry – “Nothing really in the near term .. nothing material for the next 2-3 quarters.. we’re nose to the grindstone getting these orders shipped .. we’ll call you as soon as we see capacity open up ..”
A Famine
And that pretty much sums up what happened to a giant chunk of the auto sector in the 2nd half of 2020, and Q1, 2021, leading up to the President of the US and heads of state getting involved in ‘battling the Auto chip shortage problem’. Nothing helped. Not for the near to fuzzy midterm[1].
The chip industry, a notoriously cyclical industry, with high booms and terrible busts in demand and pricing, with its gigantic, capacity-intensive fabrication plants (fabs) were booked solid with orders from the consumer electronics industry, that came way ahead of these auto orders.
In fact, these competing orders had a higher priority for the right economic reasons – higher margin consumer electronics orders, that use leading edge technology, versus the Auto industry that’s been on the lagging edge for a while. Lagging, despite the move to EVs accelerating – with Tesla et al. clearly gaining ground in the auto-market through their simpler, super popular EVs. Anyway, that’s for a later write-up, not this one.
What happened next is quite well known. A mini-nuclear winter of sorts for the auto industry..
Thanks to chip shortages painful shutdowns ensued, first by car category (with lower or lower margin demand), then multiple categories, then manufacturing plants, then entire groups of plants and virtually most (traditional) auto-maker plants across giant swathes of the US and Europe.
A Feast (almost) in other places
Meanwhile, over in Japan, Toyota is humming along – and by the end of Q1, 2020 even guided a rosier shipments (Revenue) picture for the whole year.
Tesla, a tiny dot in the auto-manufacturing firmament a few years ago, is growing shipments every quarter – still small compared with traditional car industry volumes – but ramping up seriously (roughly 80% volumes year over year). And they seem to be unfazed too. In fact, Q4, 2021 turns out be eye-popping one – Tesla shipping way more than anyone would have predicted.
And that’s what brings us to the $500 Billion dollar question[2].
What happened?
How could Toyota, a large automaker, be resilient throughout 2020 and early 2021 (some of the pixie dust appears to have worn off since)?
It’s after all a traditional automaker with plenty of gas-guzzlers in its portfolio (i.e., cannot participate in the EV spike in market demand).
What has Tesla learned about making cars, parts and sourcing for their factories which their 100+ year rivals with their huge volumes (i.e., purchasing power) have not?
Learnings
First off – No, this article is not about the auto industry, the EV leadership of Tesla etc.
This article is about finer operating points (operations planning & execution) that many, even with decades of supply chain and planning experience, appear to have missed.
A clear disclaimer – what’s written here is a hindsight-based learning, a post-mortem, not specific to any industry. Sincere attempts have been made to remove all hindsight bias.
No claims are being made by the author (or teams he works with) that they could have done a better job at ‘predicting’ the rapid downswing in the ‘early pandemic’ days, and the rapid upswing in demand soon after, for those sectors that faced what’s been described above (including the auto industry).
This article focuses on some key supply chain operating principles and practices that may have to be dusted off, looked at afresh if not challenged outright, and other evolving approaches to managing manufacturing-intensive supply chains.
Here are a few –
Identify key parts – This is not a straightforward exercise of looking at your highest dollar parts. What multi-variable analysis needs to be done to determine “key” parts? What additional ‘decision filters’ should be applied?
Use “lean signaling” not lean inventory approach especially for key parts – Ideally disintermediate your supply chain (i.e., reduce number of tiers) at least for the newer products, if you can. In either case – with long, extended supply chains (Traditional automakers like GM, Ford, VW et al.) or shorter chain ones (like Tesla), ask this: How can I rapidly collaborate (not just communicate) with my significant N tiers of supply (where N is 1, 2 .. whatever)? What are best (if not optimal) inventory levels for key parts made by the TierN supplier? Is there a better way than legacy tools (EDI, spread-sheets like MS-Excel, Google sheets, etc.)? Are internet-based supplier portals adequate?
Determine inventory levels for key parts – Toyota built strategic buffers for their key parts where and when needed. Toyota instructed its suppliers to carry months of inventory where previously they used to carry weeks’ worth only, the latter being in line with lean principles that is core to Toyota operations. How to determine what inventory levels are right? How & when to adjust? What analysis needs to be done rapidly? Which analysis can have longer cycle times?
Build real ‘relationships’ with suppliers (Tier2 and their sources, as needed) – Component (part) makers would love to work directly with the product makers (the ones whose logo goes on the product). This could be especially critical for mid-size and smaller companies that cannot command part makers’ attention via large, strategic buys. They know full well that one such wrong decision can put them into a deep working capital hole for a long time, or push them into extinction. Which component makers? What meaningful processes can you collaborate on? What are “must-haves” to make sure collaboration works (data, process, decisions, metrics)?
Plan for business continuity all the time – Business Continuity Planning (BCP) is not just for isolated worst-case events, such as the Fukushima disaster that froze auto supply chains, Taiwan earthquake that rattled consumer electronics – including the large behemoths. BCP is an ongoing process effectively used by those that are succeeding to secure the supplies needed, no matter what. How will you do this (process, people, parts, partners)? What parts to focus on? Which products? Which ones to defocus from?
Understand your key parts very well (passing acquaintance isn’t enough) – Get to know the technologies that go into your key parts, especially complex/ line-stopping ones very well (e.g., batteries for EV makers, microcontrollers for automakers, WiFi chipsets for wireless equipment makers, etc.). Build the technology skills needed so you can turn on a dime and change product design if a part’s supply shortage becomes persistent. Which technologies (chip design, etc.)? What skills? How to motivate learning?
Design for resilience and responsiveness – Back to the story above: Jill, the planning lead and her supervisor, the SVP of Ops were at a standstill and could not take decision to increase the supply even when the chipmaker dropped hints. There could be many reasons. Here are a few –
Role of planning in the org: does it have the right level of visibility and sway with the executive team? i.e., could they have pushed a more aggressive supply plan without being worried about untoward consequences (i.e., losing faith of the management, or worse)
Skills – Has Master Planning/ MRP/ Capacity Planning and related supply side operations planning skills been rethought through and retooled, especially for extended and evolving supply chains? Has demand planning been rethought through? Planning must be thought through for end-to-end Demand and Supply Planning. And then rethought through periodically in light of changes.
People-centered Processes and collaboration – Did AutoMax1 have a comprehensive process (including S&OP) which they could use to avoid bias? How good was their supplier collaboration to ensure clear supply signals – strong and weak signals (e.g., chipmaker signals noted above)?
Tools – What’s the burden of legacy? Were they going to war with bubble gum and duct-tape to put together their plans? Many legacy systems are a lot clunkier, difficult to use and error-prone, given cloud and internet-native tools can be designed and tailored for operations. And they suck up not only time but a lot of people too.
System – Were they educated about responsiveness which is not a demand side or supply side approach but an end-to-end approach? End-to-end from Demand through to Supply planning – not as ‘islands of Planning’. Execution signals have to be inbuilt into Planning.
Scaling mindset – A scaling mindset means looking at the future to be an opportunity to grow in a planned manner. How do planners avoid the “hunker-in-the-bunker” mindset that’s the default, especially in operations planning when faced with extreme uncertainty like what happened at the onset of the pandemic – circa Q1, 2020?
Question Assumptions
When faced with unprecedented uncertainty past assumptions have to be questioned.
Good planners know every plan has in-built assumptions.
Great planners know when to question those assumptions out aloud, so management gets it loud and clear. In the above case of Jill and AutoMax1, did they listen to the skeptical, dissenting voices among procurement and supply planners. The planners/ procurement team members may want to understand the signal better from the supplier/s (the chipmakers saying demand is ‘perking up’) before giving their procurement plans a massive haircut.
Great Operations leaders know Planning is a critical ongoing process that requires smarts and creativity, and focused attention of the top management (CEO, COO, Leaders of Operations and Sales, Products).
and,
The more inputs the better, especially from outside the 4-walls of the company, e.g., Sales channels, Suppliers, et al.
Most importantly, the age-old truism – not to be wedded to “a Plan”.
Plan, by its very nature is a point-of-time output of the process and needs to keep changing to support smart execution.
While nothing is better (for planners and senior strategists) than having a “run rate” product base to plan, those deep into planning and its subsequent execution, and have seen a few seasons (i.e., are experienced) know that ’stasis’ (standstill) is the absolute opposite of good planning – the wrong place to be. It’s after all a “rate”, i.e., change over time.
Companies that use this time of uncertainty to upgrade their team’s skills and equip themselves with better processes and systems based on learnings above will have all the pieces in place to go for a stronger rebound when demand turns around, and catch the downdraft in their demand much earlier, preventing grave preventable losses (E&O among others).
[1] Derivative of estimates the current size of the chip industry and the auto-industry losses
[1] Estimates vary from 2-3 quarters to 6-8 quarters out from late 2021
Acknowledgments:
The author would like to thank Colin Todd and Fred Harried for some of the learnings mentioned, and to all the (customer) colleagues at Cambium Networks for in-depth discussions and working sessions with Zyom on some of the topics mentioned in the article; All of the above contains copyrighted materials from Zyom Inc. Please acknowledge this when using any of the content.
Lead time metrics seldom gets senior leadership level attention outside of Supply Operations, until something blows up badly, such as the 2011 tsunami overwhelming Japan’s economy and its swift, cascading impact on automotive and electronics supply chains world-wide.
More recently, in the midst of the world-wide pandemic, there has been a spate of headline-grabbing bad news from large auto makers and other industries, all traced back to growing lead-time of parts/ component and products[i].
Auto makers, after seeing an unexpected surge in demand starting Q3, 2020, are now stuck in neutral, exposed to painful revenue and profit shortfalls due to semiconductor chip shortages over the near-term (calendar Q1 through Q2/early Q3, 2021), possibly longer – forced to idle factories and people, for months. Unexpectedly large (and growing) lead-time of critical parts are squeezing both top and bottom lines. All this at a time when auto, and other industries, are trying to get back to some semblance of ‘normal operations’ after intermittent and prolonged shutdowns earlier in the pandemic.
The current lead time debacle need not have been this bad, the pandemic and subsequent sharp surge in demand (across some segments) notwithstanding.
Lead time of products, key components and raw materials are critical variables which require timely and regular attention of (yes) CEO/ COO of any product company serving multiple geographies and relying on global supply networks. Now, with long and uncertain lead times in the form of persistent shortages, it has the CEO’s attention again.
How do we break out of this endless cycle of using lead time as a ‘reactive’ metric, and use it to gain an operating advantage?
What’s your Lead time? A Measurement Gap
Wildly swinging lead-times are usually the tip of the iceberg. Below the surface are many causal forces –
inadequate manufacturing capacity, new industries competing for scarce capacity and supply (e.g., auto industry vying for the same fab capacity used by electronics makers), or
gaps in planning and collaboration processes (with supply chain partners), missing system capabilities, or simply not knowing whatinnovations are available to tackle lead-time unreliability. This is the purview of this write-up.
One of the primary needs is the ability to measure the lead-time of products – quickly and accurately. To date, planners, buyers and analysts, even in larger, well-run companies find themselves leaning on spreadsheets and “notes” (from their latest calls with supplies) when asked –
“What’s the lead time of XYZ product?” – their own product, which is getting supply constrained.
Most often, the product’s lead time data in their ERP systems is dated. Makes sense – most of the lead-time info in their ERP system is supplied by the buyer/planner’s spreadsheet.
For component parts and critical sub-assemblies that are procured from suppliers, product companies are often totally dependent on the lead-time data they get from their manufacturing partners – CM[1] in hi-tech electronics product makers or Tier 1 suppliers in automotive and other manufacturing-intensive supply chains. With an arms-length relationship with the eventual parts’ suppliers (either Tier 2, or sometimes upstream), it’s not surprising that these numbers fed to the product companies can be dangerously stale.
Astute operations and supporting IT teams understand these gaps– that ERP is a system for ‘recording’ (storing) lead-time data, and not designed to measure lead-time. They need a different approach, different processes to capture this data quickly and accurately, and often, a new enabling system.
Astute operations and supporting IT teams understand these gaps – that ERP is a system for ‘recording’ (storing) lead-time data, and not designed to measure lead-time. They need a different approach..
Tackling unreliable Lead times – Focus on right Process & System
However, before embarking on a project to plug the gap – ‘fix lead-time’ data and systems, it’s important to identify any bottlenecks in the end-to-end processes from demand through supply planning and all the steps that lead to the subsequent shipments from suppliers. For supply chains that are impacted by long lead-times on components that are further upstream of their Tier 1 supplier (or CM/ODM[2]), analyzing this end-to-end process is just a start, and may not close the gap due to variability in component lead-times.
If you have not done this, it is best to wrap your arms around product lead times looking at processes and interactions with the immediate upstream tier of supply, at the get go – i.e., between the product company and its Tier 1 supplier (CM/ODM).
Once the process bottlenecks and disconnects are removed, the company is in a position to systematically measure the lead-time of their products from this vantage point (with Tier 1 supplier).
As soon as companies gain visibility and some control over product lead time, they can plan the more demanding and potentially uncharted territory of expanding these processes to include critical Tier 2 supply.
Design for Implementation and usage
Once process related constraints are identified and resolved (via suitable agreements with supply chain partners to share data), companies can proceed to the next step, namely – providing a system enabler that works in simple manner to capture lead-times.
Specialized solutions built on the cloud are ideal, since most processes are executed collaboratively. Ensure that the system is fast to implement and quickly gains traction with all users, including the supplier users. A “large, ERP mindset” (‘small army’ of people, ‘large’ implementation centered) and ‘hit-and-miss’ post implementation stabilization and usage, is a sure shot to an expensive failure.
Take the lead with your Lead time
A recent article outlines our findings of new approaches and innovations in process and system from younger, dynamic growing product companies that are successfully scaling operations while facing larger competitors, as well as larger technology companies with leading supply chain operations practices, both of which have navigated supply chain disruptions – large and small.
Use the information from this article to brainstorm with your senior leaders (CEO/ COO) specific areas that need to be re-thought through and acted upon, both at a macro and micro-process level
For example, in the case of macro-process, answer key questions such as –
How can product Lead times be measured systematicallywhich is closer to reality (if not real-time)?
What is the end-to-end process and supporting system needed that canmeasure lead-times accurately?
What is the end-to-end process and supporting system needed that canmeasure lead-times accurately?
For micro-process dive into specific processes and system changes that are economically implementable, such as –
A Lead-time review process to identify lead time outliers and take corrective actions rapidly.
Ideas from the above referenced article can help you define the extent of your lead time challenges and opportunities, providing you an outline of a few key process and system areas that need to be rethought, redesigned (as needed) and retooled. Use these to bring your lead-time picture into much sharper focus, gaining an operating advantage in the process.
Lead time requires focused leadership on process and system. Falling behind is not an option.
*Please email contactus@zyom.com with questions or additional information needs.
[2] ODM = original design manufacturer (using in hi-tech electronics supply chains)
[1] CM = contract manufacturer (in hi-tech electronics supply chain)