Inventory is a critical asset and a dangerous liability; Pointers for the COO to navigate inventory related decisions & actions for the unpredictable times (circa H1, 2025)
This AI generated podcast (using NotebookLM) is based on the text from the Zyom Blog, “Note for the COO: Inventory – the double-edged sword.” It highlights the criticality of effective inventory improvement initiatives, especially amidst market uncertainty. It emphasizes that while adequate inventory can be beneficial, excessive inventory quickly becomes a financial burden, particularly in channel-centric sales models where it can obscure underlying issues.
The author, Rakesh Sharma, stresses that inventory reduction is a strategic initiative, not merely a tactical task, leading to a structural capital advantage that frees up capital for growth. The article describes the “dual mandate” faced by COOs: balancing the need for sufficient stock to meet demand with the imperative to keep inventory levels low to minimize tied-up capital. Ultimately, it advocates optimizing connected operations management processes and increasing velocity of specific end-to-end Planning and Execution processes, to achieve significant capital efficiencies and a sustainable operating advantage.
The author advises caution in following sections of the podcast, since “process velocity” related points can be misunderstood in the AI-generated podcast.
from 6:00 to 6:43 from 7:32 to 7:40 from 8:08 to 8:18
Overall, the Author gives this AI-generated podcast high marks for capturing the key points, and worth a listen.
Please reach out directly through the Contact form provided at the bottom of the April 2, 2025 Zyom Blog in case of questions
The Balancing Act – Buffer to serve customer, vs trapped Capital (generated via GenAI)
Disclaimer: Google’s NotebookLM was used for creating this podcast, which is based on this Zyom blog
As 2025 begins, COOs in the physical goods industries with a global footprint, must focus on two areas – inventory and inflation, amidst global trade and other uncertainties (tariffs etc.). The shifting geopolitical landscape may severely disrupt inventory controls across extended value network (both supply & downstream channel/customer side), and inflate costs. Leaders should closely monitor inventory trends and adapt to inflationary pressures to mitigate potential impacts on margins and operational efficiency.
A note for COOs and team on Inventory & Inflation
(updated Feb 10th, 2025 with tariff changes & rollout updates; previous update Feb 2nd, 2025 with post-tariff imposition data & ADDENDUM at bottom; previous update: Jan 31st, 2025 5:10 pm US PST)
To start off the year 2025, we decided to read the tea leaves a different way – we went looking for clues on what will it look like this year that we should plan and prepare for? what needs to be brought into sharper focus – priorities revisited, big perils identified, collaborations renewed?
This note, for those that are in the physical goods industries – is about what should be top-most priority over the next 30 to 90 days that COO & team should focus and act on. And the focus should not diminish as the year wears on, and beyond.
The Gathering Dust Clouds
The year 2025 – is off to a strange start – a new administration in Washington that, on the surface, appears inclined towards policies which at a meta level, will fragment the world further – at least from a global supply network standpoint. This could potentially realign previously implicit “friendly nation” status, and most likely impact the free flow of goods adversely, increasing procurement costs in the US and inevitably beyond. This, given the tariffs directed at goods from Mexico and Canada among other countries, high on the incoming administration’s wish list (now a reality as of Feb 1st, 2025)
“Wall” of Tariffs, a bigger wall of uncertainty
A wall of worry has unsurprisingly descended on the most senior leaders of product companies with a global footprint, especially COOs and their cross-functional teams managing world-wide operations of US based companies that procure parts and finished manufactured goods from the countries targeted.
While speculations that new US administration’s tariff “statements” were a pre-emptive move to gain a strategic negotiation advantage have been negated by President Trump’s announcement yesterday (Feb 1, 2025), there is nervous optimism that the worst may still not come to pass (i.e., maybe a near-term, a quarter or two out type setback), or so some industry groups hope. [Update – Feb 10, 2025: Tariff implementation continue to be dynamic –
Understandably, anxiety levels are now running high – especially among senior Operations executives who source goods (semi-finished, or finished products) from Mexico and Canada, given the direct, damaging pressure it will put on COGS[1] of even well-run, US based product companies.
That the air in global trade circles is thick with anxiety over the impact of the disruptive changes, is a given. What is less understood is the impact of the inflationary headwinds, the inevitable tit-for-tat type tariff wars and low-trust trade environment will have on midsize companies, and even larger ones that do not have large cash buffers to tide them through.
The picture that emerges – of the damage this does to the balance sheet of (previously) “friendly” nations, many of who are already saddled with debt, does not look pretty. For potential impact numbers see “ADDENUM” below.
This is happening at a time when many industry supply chains could be carrying high levels of potentially excessive “inventory” with a foggy, near-term demand picture. All in all, January-February of 2025 (potentially H1, 2025) is a fraught time, uncertainties abound, especially about global trade and supply networks.
What’s an operations leader to do in such a time? Focus. Focus on these two items not just for now but all year long and beyond.
Focus-1: Inventory
Keep a “Hawk eye” on inventory. Inventory, no matter where it is in your value network – at suppliers, in your DC/WH[1], or at your channel partners, or some mix of these.
Inventory of parts/ raw-materials, semifinished and finished goods.
Pay particularly close attention to components/parts that suppliers may be holding for you, or may have been ordered from component suppliers – Tier 2 or Tier 1, based on the extent of outsourced manufacturing you have deployed.
Keep a sharp focus on how inventories are trending at your channel partners (distributors, VAD[2]s etc.) in the case of channel centric sales model, and/or your largest direct customers, and prepare to take informed actions swiftly to right size channel inventory levels ASAP, when needed.
Keep a sharp focus on how inventories are trending at your channel partners.. your largest direct customers .. prepare to take informed actions swiftly to right size channel inventory levels ASAP
In fact, look at every nook and cranny where high value inventory may be collecting and gathering dust.
Then step back, make informed decisions based on upcoming demand, which in this environment could be much harder to pin down.
Excess inventory can severely disrupt product and technology transitions too – for example, holding back product companies from transitioning products to new hardware/software platform, to key parts, or to an entirely new industry standard. Often, such a transition comes with advantages for the product maker (lower unit costs, better performance, etc.) and their customers (lower price points for similar or better capabilities). With excessive inventory, a product company gets stuck on older versions of their products – unable to obtain the advantages of achieving a lower price point for similar or better output performance for a much longer time, or ever.
A quick point – That end of quarter demand “hockey – stick” needs to be looked at with a new lens too. Today’s hot order, which will put us well over the top end of our quarter target(s), could be a noose around our necks in a quarter or two, or soon thereafter. Change sales incentives if need be. Unusual times call for businesses to not operate “as usual”.
Mind the “inflation gap” – the gap between “newly normalized inflation rates” (macro, estimate of inflation based on ‘aggregated’ data), and what is actually happening (actual inflation rates faced by manufacturers/suppliers in the supply chain).
Yes, Chair Powell and Federal Reserve team have done a heck of a job when it comes to taming the inflation beast, but with uncertain times ahead – unpleasant realities (unanticipated sudden spike*, stubborn or higher inflation, etc.) can come to pass rather quickly.
* In light of the announced Trump Tariffs a sudden spike in inflation is all but guaranteed on some key goods imported from nearshore manufacturing partners Mexico and Canada – food, fuel, autos and electronics to name a few.
As the US and other prime-mover, free market economies, enter an uncertain phase of the business cycle (have we landed yet ? hard or soft landing, or some mix of those?), and the predictable purchasing price inflation caused by tariffs imposed on inbound goods into the US, the job of Supply operations team – planners, procurement and manufacturing – has to be redefined and skills upgraded quickly.
Monitoring impact of inflation on piece parts’ and other key input prices (labor, etc.) will not be a one off that many experienced during the pandemic, but will become a regular feature of their role. And the smartest, forward-thinking operations leaders already get it, and working on capabilities to enhance their team’s performance.
Monitoring impact of inflation on piece parts’ and other key input prices (labor, etc.) will not be a one off that many experienced during the pandemic, but will become a regular feature of their (Supply Operations – Planner, Procurement) role.
They are building better processes enabled by new digital capabilities so procurement/materials management teams are “always on” when it comes to sniffing out an imminent threat of inflation so it can be snuffed out.
Most Operations teams (Procurement, Manufacturing), already went through a bruising time as the shock of the initial lockdowns of the pandemic gave away to the shocking increase in lead times and unit cost of inputs.
This time around it could get a lot tougher. Because, we don’t yet know if we are sliding towards a slowdown or recession – mild, medium or severe – this year (next 2 to 3 quarters are key), or, are we racing down.
For when the chips are (really) down across all product companies, i.e., the downward part of the business cycle, and trading partners are not seeing eye to eye, and inflation rears its head in ugly way – there may be no place to hide.
Your COGS will get a bruising.
Your margins may get neutralized, and you may bleed into the red.
Key Questions & Question the Status Quo
These are the two things for COO and their teams to focus on this year and harness all their collective energies to stay ahead of any potential disruptions. Some key questions to prepare better:
a) What will be the impact of inventory (starting with inventory downstream in the channels/ at customers, working backwards to parts level inventory) if product uptake deviates from plan, or other changes/ events happen which dampen demand or modify it significantly? What key decisions need to be taken? When and how to minimize any adverse impact?
b) How to monitor inflation and its impact on product cost? What specific approach and actions (smart negotiation, smart sourcing among others) can companies deploy to get ahead of the curve on tariffsthat will lead toinflation in procurement costs? What tools will be needed support such actions to mute or mitigate the impact of higher prices? What’s the the best way to measure the impact on product costs (bottom-up, top-down, other) and evaluate options?
As Supply Operations and Demand-gen operations team rush from one quarter to the next, what should the cross-functional teams plan and be prepared for, so they can harness experience, data, insights and tools, including enterprise software, as needed, to:
Plan and prepare for different scenarios (cost changes/ increases, sourcing changes, changes to supply chains, etc.)
Get alerted on deviations in Inventory & Inflation (tariff driven or otherwise)
Make data-informed decisions (clean data available via collaboration is key)
Ensure that learnings from deviations can be captured for the future
Question any responses that sound like “business as usual”.
What can we do?
Reach out and build new partnerships – not just with new physical goods suppliers but with digital (and expertise based) goods suppliers.
Companies (at least in the US) need to start looking inwards within the US, to find reliable, quality manufacturing and other supply sources here – including upstream component & commodity suppliers, assuming their cost structure and business model supports it.
Near term
Start working on establishing relationships with US based manufacturers sooner than you previously thought.
In the near term (current Quarter to 3-4 quarters out), higher quality, cost-competitive US based manufacturers may see their capacity getting quickly gobbled up, as product companies turn inwards. Better to “reserve capacity” now, before you are “shut out”, or are put on a “waiting list”.
New factory capacity and capability takes a long time to come online, be vetted and ready.
And, of course, negotiate with your suppliers in the tariff impacted countries – Mexico and Canada, for now. Its surprising how adversity can create more open channels of collaboration provided these are the right partners.
Longer term
Longer term (2-4 years and beyond) – the jury is still out. However, some of these tariffs may gain wider (not just “populist“) support across policy makers and end customers, and may become sticky in some industries – especially, if it lifts up nation-specific manufacturing capabilities (in this case, lifts up American manufacturing broadly).
So, this may also be the time for longer term plans which may include:
a) vertical integration via acquisition (acquiring the right manufacturers, critical upstream supplier), and/or
b) putting down concrete near-term plans to invest in your own factories here in the US (or wherever the company’s home-base is), with the goal of pouring concrete soon, or acquiring a factory or more, if needed
c) Hone your manufacturing supplier relationship management skills which has been blunted over the past 2+ decades of outsourcing in many industries. No, not the classic sourcing (RFQ based identification of competent suppliers, etc.), but getting waist deep in the trenches with your manufacturing partners – sharing know-how and collaborating deeply on your product specific manufacturing, materials management, collaborative planning, supply chain and even factory operations management. Yes, some skills have been dulled or lost over time. Yet this short-term pain may serve many product companies well – if its used to sharpen these skills again.
These are big changes with potential for big disruptive operational impacts on product companies near-term. However, longer term their effects could be virtuous, if your product company starts planning and preparing now.
To learn more on how we, and our advisors, have specifically helped support our customers, feel free to reach out.
We can share a few specifics, real-life stories, ideas and more of what we have learned working with senior leadership, and their cross functional operations teams across this business cycle and before, across two Fortune 100 companies and smaller, dynamic product enterprises.
Or, leave a comment here That will be music for our ears, and we will respond.
ADDENDUM
New details are emerging about the tariffs and its potential impacts (including price #inflation for US buyers and #supply-shock); some numbers are stark:
A few headline numbers from Bloomberg Economics analysis:
tariffs affect trade worth about $1.3 trillion,
represent 43% of US imports and
impacts roughly 5% of US GDP.
raises the average US tariff rate from near 3% currently to 10.7%, and deal a significant supply shock to the US economy
Utilizing Federal Reserve Board model parameters (from Trump’s first term) suggest this could reduce GDP by 1.2% and add around 0.7% to core PCE (read – inflation).
new tariffs on Canada, Mexico and China will cost the average American household $1,245 in purchasing power (per year), trim GDP by 0.2%
Acknowledgement(s): All customer colleagues we have worked with over the past 15+ years. A special shout-out to the Cambium Networks cross-functional Operations team, and to the insights gained working with cross-functional teams at Samsung Electronics and 2Wire (now CommScope). Michael Dodd (formerly senior Operations executive at Leapfrog, Juniper among others, and advisor to Zyom)
Disclaimer: No Generative AI was used for composing any of the writeups here (including this one), nor for any data gathering; At this point of time, Generative AI is being used in a “limited editor/ summarizer” role only, not to generate any new content on this site. Readers will be informed in advance if this changes.
Lead time metrics seldom gets senior leadership level attention outside of Supply Operations, until something blows up badly, such as the 2011 tsunami overwhelming Japan’s economy and its swift, cascading impact on automotive and electronics supply chains world-wide.
More recently, in the midst of the world-wide pandemic, there has been a spate of headline-grabbing bad news from large auto makers and other industries, all traced back to growing lead-time of parts/ component and products[i].
Auto makers, after seeing an unexpected surge in demand starting Q3, 2020, are now stuck in neutral, exposed to painful revenue and profit shortfalls due to semiconductor chip shortages over the near-term (calendar Q1 through Q2/early Q3, 2021), possibly longer – forced to idle factories and people, for months. Unexpectedly large (and growing) lead-time of critical parts are squeezing both top and bottom lines. All this at a time when auto, and other industries, are trying to get back to some semblance of ‘normal operations’ after intermittent and prolonged shutdowns earlier in the pandemic.
The current lead time debacle need not have been this bad, the pandemic and subsequent sharp surge in demand (across some segments) notwithstanding.
Lead time of products, key components and raw materials are critical variables which require timely and regular attention of (yes) CEO/ COO of any product company serving multiple geographies and relying on global supply networks. Now, with long and uncertain lead times in the form of persistent shortages, it has the CEO’s attention again.
How do we break out of this endless cycle of using lead time as a ‘reactive’ metric, and use it to gain an operating advantage?
What’s your Lead time? A Measurement Gap
Wildly swinging lead-times are usually the tip of the iceberg. Below the surface are many causal forces –
inadequate manufacturing capacity, new industries competing for scarce capacity and supply (e.g., auto industry vying for the same fab capacity used by electronics makers), or
gaps in planning and collaboration processes (with supply chain partners), missing system capabilities, or simply not knowing whatinnovations are available to tackle lead-time unreliability. This is the purview of this write-up.
One of the primary needs is the ability to measure the lead-time of products – quickly and accurately. To date, planners, buyers and analysts, even in larger, well-run companies find themselves leaning on spreadsheets and “notes” (from their latest calls with supplies) when asked –
“What’s the lead time of XYZ product?” – their own product, which is getting supply constrained.
Most often, the product’s lead time data in their ERP systems is dated. Makes sense – most of the lead-time info in their ERP system is supplied by the buyer/planner’s spreadsheet.
For component parts and critical sub-assemblies that are procured from suppliers, product companies are often totally dependent on the lead-time data they get from their manufacturing partners – CM[1] in hi-tech electronics product makers or Tier 1 suppliers in automotive and other manufacturing-intensive supply chains. With an arms-length relationship with the eventual parts’ suppliers (either Tier 2, or sometimes upstream), it’s not surprising that these numbers fed to the product companies can be dangerously stale.
Astute operations and supporting IT teams understand these gaps– that ERP is a system for ‘recording’ (storing) lead-time data, and not designed to measure lead-time. They need a different approach, different processes to capture this data quickly and accurately, and often, a new enabling system.
Astute operations and supporting IT teams understand these gaps – that ERP is a system for ‘recording’ (storing) lead-time data, and not designed to measure lead-time. They need a different approach..
Tackling unreliable Lead times – Focus on right Process & System
However, before embarking on a project to plug the gap – ‘fix lead-time’ data and systems, it’s important to identify any bottlenecks in the end-to-end processes from demand through supply planning and all the steps that lead to the subsequent shipments from suppliers. For supply chains that are impacted by long lead-times on components that are further upstream of their Tier 1 supplier (or CM/ODM[2]), analyzing this end-to-end process is just a start, and may not close the gap due to variability in component lead-times.
If you have not done this, it is best to wrap your arms around product lead times looking at processes and interactions with the immediate upstream tier of supply, at the get go – i.e., between the product company and its Tier 1 supplier (CM/ODM).
Once the process bottlenecks and disconnects are removed, the company is in a position to systematically measure the lead-time of their products from this vantage point (with Tier 1 supplier).
As soon as companies gain visibility and some control over product lead time, they can plan the more demanding and potentially uncharted territory of expanding these processes to include critical Tier 2 supply.
Design for Implementation and usage
Once process related constraints are identified and resolved (via suitable agreements with supply chain partners to share data), companies can proceed to the next step, namely – providing a system enabler that works in simple manner to capture lead-times.
Specialized solutions built on the cloud are ideal, since most processes are executed collaboratively. Ensure that the system is fast to implement and quickly gains traction with all users, including the supplier users. A “large, ERP mindset” (‘small army’ of people, ‘large’ implementation centered) and ‘hit-and-miss’ post implementation stabilization and usage, is a sure shot to an expensive failure.
Take the lead with your Lead time
A recent article outlines our findings of new approaches and innovations in process and system from younger, dynamic growing product companies that are successfully scaling operations while facing larger competitors, as well as larger technology companies with leading supply chain operations practices, both of which have navigated supply chain disruptions – large and small.
Use the information from this article to brainstorm with your senior leaders (CEO/ COO) specific areas that need to be re-thought through and acted upon, both at a macro and micro-process level
For example, in the case of macro-process, answer key questions such as –
How can product Lead times be measured systematicallywhich is closer to reality (if not real-time)?
What is the end-to-end process and supporting system needed that canmeasure lead-times accurately?
What is the end-to-end process and supporting system needed that canmeasure lead-times accurately?
For micro-process dive into specific processes and system changes that are economically implementable, such as –
A Lead-time review process to identify lead time outliers and take corrective actions rapidly.
Ideas from the above referenced article can help you define the extent of your lead time challenges and opportunities, providing you an outline of a few key process and system areas that need to be rethought, redesigned (as needed) and retooled. Use these to bring your lead-time picture into much sharper focus, gaining an operating advantage in the process.
Lead time requires focused leadership on process and system. Falling behind is not an option.
*Please email contactus@zyom.com with questions or additional information needs.
[2] ODM = original design manufacturer (using in hi-tech electronics supply chains)
[1] CM = contract manufacturer (in hi-tech electronics supply chain)
The Sales kick-off went quite well. Now is the time to take one more look at what 2014 looks like from the vantage point of forecasting before real constraints set in.
Economic forecasters have long utilized ‘leading’ and other “indicators” as a barometer to predict where the economy will be headed in the future. Inspired, we have pulled together the following ‘early’ indicators that can provide useful ingredients in influencing if not generating a Company’s forecast. While all forecasts are off, early indicators can be used to understand the ‘trajectory’ and a portion of the variance in the forecasts that is otherwise hard to estimate.
Here are some early indictors and macro-data[i] as you craft your forecast for 2014.
Early indicators – the Macro
Weather events & the US – Climate .. or at least the weather took center stage early in January as temperatures plunged in vast swaths of the US disrupting life and business. The near term effects have been significant but not severe. The initial price tag of the big chill is placed at $5Billion (as of early January 2014). Doesn’t appear devastating given nearly 200 Million people were affected. However, long-term effects should be lesser to none.
The good news – the US economy turned in a fair 2013 (3.2% GDP growth in Q4, 2013 versus 1.9% for the year) and early indicators suggest 3% for 2014. In the near-term the US certainly seems to be back on track, and maybe at the wheel in terms of driving the global recovery.
Estimated Impact – Of storm – Near-term only (3 weeks to 2 months); US Growth – stable for 9-12 months[ii]
Emerging markets – Short-term growth prospects have been hurt. Turkey made headlines with an egregious interest rate hike in January. However, emerging market countries as far-flung and diverse as Argentina, South Africa, Indonesia and India seem to be facing stiff economic headwinds too. Brazil seems drawn into a stagflation, just months from the big kick-off!
Estimated Impact – Near to Mid-term (9 to 18 months depending on markets)
China’s growth phenomenon – China’s slowdown has arrived per data and economists – 7.7% GDP growth in 2013 Year-over-Year, versus 7.8% growth the year before. While debate is split about future direction of this important market, all data points to a gradual deceleration and not an absence of growth. Structurally, data regarding the supply-side limits are cause for bigger concern (China’s working age population fell by 2.44 Million in 2013 after falling the year before – The Economist Jan 25th 2014).
Estimated Impact – Near to mid-term slower growth (10 to 12 months); Longer-term growth could be adversely impacted.
Japan and EU – These key developed markets still seem to be stuck in neutral with dangers of deflation not gone.
Estimated Impact – Tepid growth. Foggy at best for the next 6-9 months
Housing starts – A key “leading” indicator of future economic activity is in positive territory in the US, Germany and England (Jan 2014 compared to a year ago).
Estimated Impact – Could imply some progress for Construction and related businesses (home products, home solar products, other home/consumer products).
Early indicators – the Micro
New orders and new customers – Both are good early indicators
Orders for new products –are valuable early indicator, especially for industries such as the Hi-Tech electronics industry that rely heavily on new products for significant portions of their revenue stream. For example, for the Wireless networking industry, how are the orders coming in for the 11ac products (based on new networking standard) and how are the prices trending.
Inventory (especially Channel Inventory) & lead-times – are key early indicators. While channel inventories are typically co-managed, tracking this can provide valuable clues.
Backlog – A very good gauge in the near-term to establish revenue trend. However, this needs to be taken with a pinch or heaps of salt. Why? This depends on how effective are your supply chain fulfillment operations.
And that’s where the rub is – since some of these indicators depend on a ‘healthy forecast’ so we are back to the ‘chicken and egg’ problem.
These are a few of the key ingredients to consider as ‘early indicators’ in updating or building your forecast – at least for the mid-term: 0 to 6 months.
Overcast or Sunny? For those who dare to Forecast
Even with the best processes and systems the age-old truth holds – All Forecasts are incorrect, especially at the get-go. However companies can disproportionately benefit if they:
i) Include ‘early indicators’ in the forecasting process in a simple way
ii) Make Forecasting (the process) one of the book-ends of the Demand Planning process, which flows seamlessly as a part of the overall Sales & Ops Planning and execution process
And yes, lets plan to loop back after the proverbial dust has settled on the quarter (or, quarters) to figure out how far off was the Forecasted Demand. And while we are at it.. why not find out why, and how the indicators have changed. As the adage goes..
“Forecasting is the art of saying what will happen, and then explaining why it didn’t! ”
As we prepare for another spin around the sun, we found it fitting to reflect back on 2013 learnings, and take a glimpse at our crystal ball for the journey ahead in 2014
Takeaways – 2 short stories
Thanks to interactions with our customers, partners and other practitioners, the year was chock-a-block full of learnings. 2 highlights:
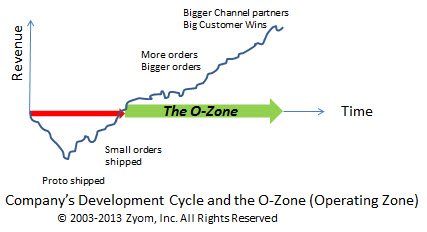
1) How does a young company know when they have entered the Operating or ‘O’-Zone? Over the last 4+ years we had the privilege of watching a company (Ruckus Wireless www.ruckuswireless.com) blossom into a significant player in a newer segment of the networking industry. As a solution provider, we have worked and thought hard about the development lifecycles of high growth, high change industries for over a decade, wondering how & when a company knows that they have come of age, or entered the critical ‘O’-Zone, as we define it. O for Operating. As defined in a previous blog (http://bit.ly/MemoToChiefExec ) young Product companies that enter the O-Zone see big changes- from shipping 10s or 100s of units a month of a handful of products, they are quickly thrust into a bigger, rapidly growing Operation – 1000s, potentially tens of 1000s of units being shipped, and this transition can be a mean one. Managing this transition requires the ambidextrous qualities of careful orchestration as well as rapid,intuitive decision-making and execution.
This year we got some great data-points. Those at the forefront of Supply and Sales Operations functions– Order Fulfillment, Supply Chain, Channel Sales managers – enjoy a key vantage point to see this transition as it unfolds. This valuable insight (that a young Product company has entered the O-Zone) if utilized in a timely manner can be harnessed for a greater Operating advantage that can be sustainable over several years.
2) Where do the Highest Impact Collaboration initiatives spring from? How? – As young companies enter the Operating Zone of their development cycle, processes and systems related to collaboration cannot be left to chance or management directives. Systematic Collaboration becomes especially critical between functions that may appear to have conflicting objectives and metrics in the near-term – for example, Sales focus on Revenue Growth and Ops on Cost Control. However, collaboration cannot be regimented through management directives. The genesis of high impact collaboration initiatives happens usually in the trenches, and its success rests exclusively on the efforts of those that get the work done. Take the case of ProductCo – a Product Company (all names changed for anonymity).
As volumes have grown quickly at ProductCo, fulfilling orders in a timely manner has become challenging for Operations. Shelley in Supply Chain Ops figures out that she ships a portion of products every week to the same Distribution partners and her colleague on the Channel Sales side – Julia – needs support. Support, so she can systematically compile sales data, interact with her Distribution partners effectively to understand downstream demand and provide quick signals back to Shelley in Ops, with all the data literally at her fingertips. Shelley (Supply Chain) runs this need by her manager, who points them to a systems vendor for brainstorming. Out of Julia (Sales) interactions with the vendor springs a collaborative system which will yield data and demand insights for the ProductCo in the near-term and on an ongoing basis. No major hullabaloo over the choice of systems, just a single-minded focus on working jointly with the vendor, across functions to improve the customer experience – through faster and accurate collaboration utilizing fresh data. All this happened because the initial thought to change came from within, was nurtured by a progressive management and collaboration culture, and effectively implemented working with a solution vendor as a partner.
Leaping forward in 2014.. and beyond
a) Collaborating systematically across functions and partners will gain traction going beyond cookie-cutter approaches : 2014 will see the onset of specialization in a critical collaboration area- Sales & Operations Planning and Execution. Dynamic companies will demand more than the cookie cutter approaches that have been offered to date. Industry specialization, smarter demand management methods, more tailored data and workflow linkages which will result in a faster and smarter collaboration between Sales, Supply Chain and their partners.
b) Leading companies and younger aspirants will refocus on profitability and away from a singular focus on Revenue growth only– Whether motivated by competition, financial valuations, cost of capital or more mundane business prudence, leading Product companies will focus back to product and operational profitability, and will be rewarded richly (http://reut.rs/1hagYpN ). Those that fall short will start seeing their valuations drop, resulting in erosion in market standing over time. Profitable Revenue growth will become the mantra of those who are at the head of the pack and intend to stay there.
c) System Implementation will capture center stage as a core success factor : As the botched rollout of the Affordable Care Act (ACA) website revealed (http://bit.ly/ObamacareIssues), bringing a website “up” is no guarantee of its success. Systems implementation requires a rich, complex set of interconnected activities to be completed in a timely and cost effective manner. This fate has also befallen many a system implementations in the private sector too. Since private companies can afford to throw a blanket of secrecy over such bungling, we hear only of the spectacular failures (http://ubm.io/JpGedn). 2014 and beyond will bring renewed focus to the arts and sciences of effective systems implementation.
The tide is turning. Channel partners and key customers are moving fast to your products..
Just as you were preparing to hear the beautiful humming sound of a well-oiled Operating machine shipping products out – you hear some ugly, jarring noises –
‘Hot-selling product has gone on allocation’
‘Big Channel partners are getting frustrated, as lead times start creeping up’
What happened? The Critical ‘O’-Zone
First, the good news – You have reached a major inflection point in your development cycle. You are no longer a small, obscure supplier waiting for the next large order. Orders are now waiting for you. Congratulations!
The not-so-good news – these orders will not wait long before they jump ship to a competitor.. Channel partners may divert attention to these competitors too.. So, what happened?
You just entered what we call the ‘O’ Zone (the “Operating” Zone). This is that part of your lifecycle (“zone”) when customers want to see you Operate like clockwork– shipping out 10x, 100x or more volume than before, yet meeting delivery dates globally, at attractive price points.
What happens in this vital phase of your Company’s development cycle is going to be determined in a big way by a critical collaboration – Near Real-time Collaboration between your Salesand Manufacturing/ Supply Chain Operations (Ops) team.
What’s causing these pains? No ‘growing pains’ is not a good label. Here is a critical one–
Divergent metrics & its impact on Sales & Operations
Your Sales team is focused on hyper-growth – signing up new Channel partners, winning new deals with end customers despite tough competition.
They are totally focused on order volume (Revenue) metrics, and compensated appropriately. So, they make sure they open up the gates and get more customers, more partners and more orders in. But hold on!
Do they have enough time to pivot to their Ops partners – give them a heads up about new customers, what product forecasts will be like?
Your Ops team, on the other hand, has an increasingly complex balancing act as demand takes off. They can grow their Supply Networks – to an extent (signing up new sources – new CM/ ODMs, new suppliers, etc.) to gain extra capacity, but then they hit the brick wall – of ‘Cost’ centered metrics.
The strains start to show in interactions between Sales & Ops.
The offshoot of all this is not pretty – As orders increase, Ops fulfillment can be in lock step only for a little while, after which demand and supply diverge. For Ops, it becomes a guessing game –
Q. What will Sales sell? How much buffer stock should we keep?
For Sales it becomes a hand-wringing exercise, as they field questions from customers –
Q. When will our orders ship? Why can’t you deliver it sooner?
With ‘Keep cost down’ as the guiding principle for Ops, it becomes a crazy dash to expedite when demand swings up with little notice, flying goods over instead of the more inexpensive modes (sea, rail or road) – depleting margins.
The human costs are bigger – anxieties mount as Sales & Ops try to play a game which looks somewhat like – catch the ball ‘blindfolded’.
Key to growth – A Vital, Systematic collaboration
In the O-Zone (operating zone) we need to play carefully – Pay special heed to the needs of this collaboration which is vital for growth –
Between Sales & Supply Chain Operations
To start off – Metrics need to be aligned.
How about rallying both Sales & Ops around ‘Profitable Growth’ metrics?
Let’s discuss it as a team at the leadership levels first. At a minimum – Sales, Supply Chain Operations, Operational Finance and you, should participate. The dividends of playing smart in the O-Zone are huge – Growth with Profitability – A distinct Operating Advantage. We, at Zyom, will be glad to help and explain further.
The most serious Risk that Companies with extended supply chains face is – the ShortageRisk. In the wake of the Japanese earthquake and tsunami[i], the floods in Thailand and a fire that took significant capacity of a critical automotive industry resin offline[ii] – ‘major supply shocks’ have taken center stage. But these are only a small subset of the Shortage risks that Companies and their Supply Chains face.
Often, the more mundane, ‘garden variety’ shortages that Companies face on a daily basis, can pack a vicious punch – making a serious dent in a company’s competitiveness, if not pushing it off the cliff!
Let’s understand why Shortages are the biggest risk now and examine potential warning signs that shortages maybe just around the corner.
The Destructive Impact of Shortages: For the want of a nail..
Shortages impact all companies downstream of the manufacturer facing shortages – to varying degrees. Sometimes, shortages can cut across industries.
For example, if Amazon buys up significant capacity of TFT glass (a specialized LCD used in different products) for its next new Kindle launch, that can cause shortages in unrelated industries – such as at video-game makers or electronic-toy makers. Even, the most agile Operations executives can get blindsided in such cases.
The impact of shortages can be severe. Dynamic young companies trying to ship products, stand to lose a lot. But even larger companies are not immune (Smartphone Biz Hurt by Own Success as Chip Supply Shrinks[iii]). Beyond the obvious Revenue impact, shortages can:
– turn away new customers (revenue hit),
– put-off existing customers (satisfaction erodes, loyalty and customer lifecycle value diminishes),
– cause unintended consequences (long lead-time for large companies downstream or an entire industry[iv])
– worse (perception of poor management controls, even if incorrect, adverse competitive impact[v])
Any one of these is bad enough. Their compounding effect can be devastating.
Avoid getting Blindsided – Warning Signs
At a time of such a tepid recovery, leadership across companies of all sizes should take note of this threat and ask – What are the warning signs that we are exposed? Here are a few critical ones we have found helpful:
1) Frequent over-forecasting by Channel partners and Field Sales – Manufacturing Operations team frequently asked to jump through hoops to increase shipment quantities at short notice, often to find later that forecasts were lowered.
2) Dependence on very few suppliers – OEMs totally dependent on few Contract Manufacturers (in the Hi-tech electronics industry) or Tier1 suppliers (in the Auto industry) who are also major suppliers for other competitors. BOMs with a high percentage of single-sourced items should also throw up red flags.
3) Visibility limited to key suppliers in the first tier of supply only– For an OEM this means having the ability to manage and monitor the performance of direct suppliers only, in the best case (CM/ODMs or Tier1 Suppliers [vii]), and no visibility beyond that[vi].
4) Frequent Allocations sometimes even on ‘run rate’ products – For products that start approaching stable sales patterns, alarms should go off if shortages occur, before these products go on hard ‘allocation’.
5) Quarterly Business Reviews (QBR) with suppliers showing ‘strain’ or going ‘too smoothly’– If QBRs with Supply Chain partners start showing strains due to unplanned costs,etc.– that’s an early warning. Dangers may also be lurking, if no disagreements arise.
6) Total time to respond to demand changes is unknown or too long – When it takes too long to answer – “How long will it take to ship a 10% upside?” or the range is too wide (“a few hours to a few days”) – that’s a red flag.
There are exceptions to the above. However, time and again, across different companies and industries we have found the above provide a good check-list to harden Supply Chain processes and systems against shortages.
Have you been part of a recent ‘shortage event? Did you see any other warning signs? Other Supply Chain risks that are bigger?
[i] Japan and the global supply chain: Broken links; The Economist; March 31st, 2011
iii) Inclination to hoard cash/ other liquid assets (even inventory)
Apple’s huge inventory of cash (about $97 Billion, as of quarter-end 2011), underscores how the traditional wisdom – ‘saving for a rainy day’ – takes on a whole new meaning in uncertain times.
Thriving in Uncertainty – Key elements
Taking stock.. of response
Uncertain times open up a window of opportunity for companies. Smaller companies with strong product offerings that are competitive in price/performance can see sales solidify, even increase. How? Industry research [see note1] and our own work reveal companies are focused on building-out a key capability – End-to-End Responsiveness to Customer/Channel demand.
What does this mean? This is what a typical customer of a responsive company experiences:
“When we change demand, they act on it right away. I hear back from them quickly (within minutes) on what’s the impact – on availability and cost? Its quite accurate ..They present me with options. It’s great! I can make smarter decisions.. wish others did the same”.
This is much easier said than done. For Product companies that do not have a large-company’s purchasing power, to excel at ‘Responsiveness’ some key elements need be in place –
i) End-to-End Supply Chain visibility & execution
ii) MeasurableMetricsto get an accurate & speedy picture of Total Supply Chain Response & Cost
Responsive Ops– What it is not? What it can be?
This doesn’t require huge investments in consulting or in expensive systems. What is required, to start off, is recognition at the leadership level that it’s a critical competency which needs to be mastered. Left unaddressed, it can become a huge problem.
Explaining a recent disappointing quarter – Meg Whitman, HP’s CEO, summarized the challenges this way – While HP is “world class” in buying components, “I’m not sure I’d say we were world class in terms of how we think end to end about supply chain.”
While this may seem applicable for large companies under duress, it is not. Far from it, this should make smaller, ambitious companies with innovative products galvanize their best resources to focus on this competency – End-to-End Supply Chain Responsiveness to Channel Demand. Reading closely the quote from Ms. Whitman implies – Purchasing power isn’t everything. End-to-End Supply Chain Responsivenesscan be a singular disruptive competency that smaller companies can wield!
Has ‘Faster response’ or ‘End to End Supply Chain’ come up in internal discussions as an “issue”? In what context? Would you like to receive a Case Study on this topic?Learn more? Please let me know or leave a comment.
—
[note 1] UPS 2011 Changes in the (Supply) Chain Survey


")

