Ops leaders struggle to assess customer demand related risks in real time. This increases revenue risk. This is a bigger issue amid rising uncertainties like tariffs and inflation (circa 2025). Learn one of the many ways how Zyom helps customers such as Cambium Networks tackle Revenue risks.
Most Operations leaders can’t answer in real time, or even near real time:
Which portion of my planned customer demand is at risk this quarter?
Which orders are at risk?
“At risk” here implies a significant likelihood that customer orders would not materialize, or even if it does, cannot be shipped on time.
Changing signals make it impossible to get demand and supply plans aligned, even using well-crafted spreadsheets and sophisticated, but siloed systems — planning cycles drag, errors creep in, critical Revenue and cross-functional meetings and forums (such as Sales & Ops Planning or S&OP) result in more unanswered questions, and by the time the risks are visible, revenue is already slipping away, or worse (orders lost to competitors).
In times of “garden variety” uncertainty these questions to uncover risk are hard to answer. In an environment of high uncertainty such as now (starting circa Q4 , 2024, to late Q3, 2025 in the US), identifying demand risk has become increasingly frustrating. Largely due to tariffs and pressured trade relations which directly impacts significant trade volumes from partners across the board (larger partners such as the EU, Japan, South Korea, and relatively smaller ones like Vietnam), these risks have increasingly grown for US based product companies. And this without taking into account the slowing employment picture and persistent inflationary trends which, in many industries, is already dampening if not damaging demand.
Branded product manufacturers like Cambium Networks cut planning cycles by 60%-80% and gave key executives and operating team members direct line-of-sight into supply risk with Zyom, starting in 2017. Their SVP of Ops called it “a system that brought our vision to fruition.” Cambium continues to partner with Zyom as it navigates demand corrosive uncertainties.
If you can’t see revenue at risk until the quarter’s target is already slipping, and key operating team members are scrambling to get supply inbound, you’re too late.
Key Questions for COO and Operations team
What is one key system capability from a supply Operations standpoint that companies such as Cambium need to ensure they spot revenue risk as early as possible? How should this capability evolve?
What is one valuable decision prompt that the system can automatically provide to speed up decisions and actions from Supply Operations? This was not technically feasible prior to the advent of the newer generative AI technologies (late 2022 ChatGPT launch). i.e., traditional Machine Learning approaches till the public advent of GenAI (LLM) technologies.
To find out more, drop a comment here, or email us at: products@zyom.com
Sources & Acknowledgement: Zyom’s Cambium Networks Case Study.
John Duvenage provided key inputs to structure and composition.
Disclaimer: Generative AI was not used for composing any of the writeups on this site (including this one). GenAI was used to generate the pictures in this article and for content summarization. At this point of time, there is no plan to use GenAI to generate new content on this site. Readers will be informed in advance if this changes.
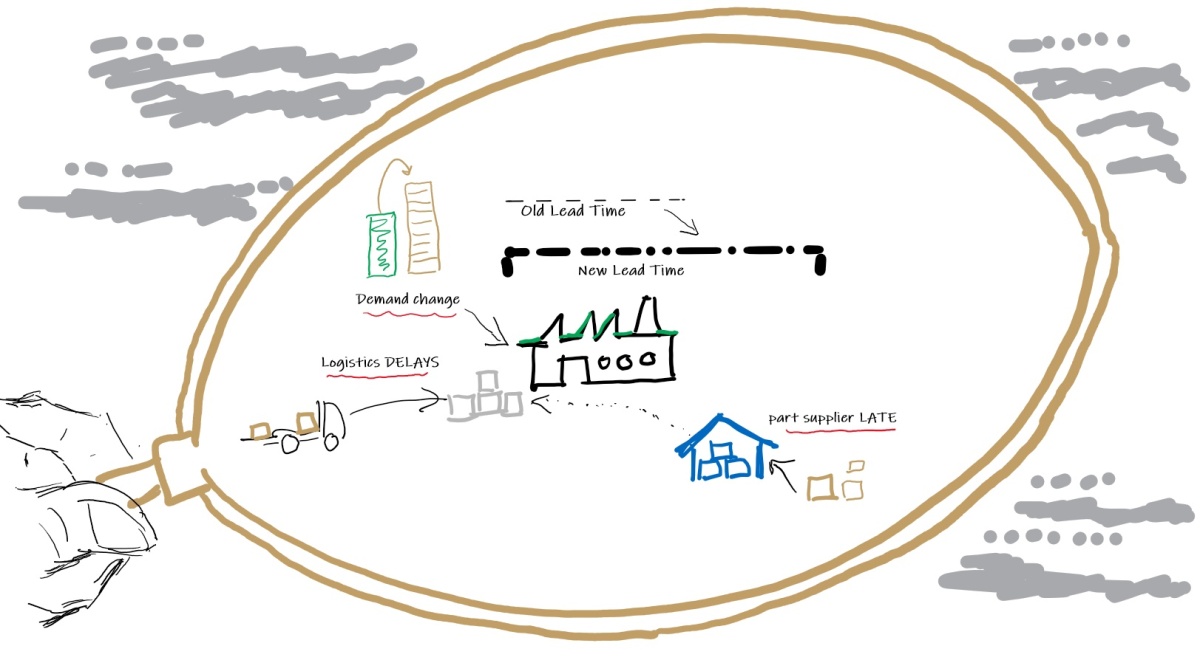
Lead time metrics seldom gets senior leadership level attention outside of Supply Operations, until something blows up badly, such as the 2011 tsunami overwhelming Japan’s economy and its swift, cascading impact on automotive and electronics supply chains world-wide.
More recently, in the midst of the world-wide pandemic, there has been a spate of headline-grabbing bad news from large auto makers and other industries, all traced back to growing lead-time of parts/ component and products[i].
Auto makers, after seeing an unexpected surge in demand starting Q3, 2020, are now stuck in neutral, exposed to painful revenue and profit shortfalls due to semiconductor chip shortages over the near-term (calendar Q1 through Q2/early Q3, 2021), possibly longer – forced to idle factories and people, for months. Unexpectedly large (and growing) lead-time of critical parts are squeezing both top and bottom lines. All this at a time when auto, and other industries, are trying to get back to some semblance of ‘normal operations’ after intermittent and prolonged shutdowns earlier in the pandemic.
The current lead time debacle need not have been this bad, the pandemic and subsequent sharp surge in demand (across some segments) notwithstanding.
Lead time of products, key components and raw materials are critical variables which require timely and regular attention of (yes) CEO/ COO of any product company serving multiple geographies and relying on global supply networks. Now, with long and uncertain lead times in the form of persistent shortages, it has the CEO’s attention again.
How do we break out of this endless cycle of using lead time as a ‘reactive’ metric, and use it to gain an operating advantage?
What’s your Lead time? A Measurement Gap
Wildly swinging lead-times are usually the tip of the iceberg. Below the surface are many causal forces –
inadequate manufacturing capacity, new industries competing for scarce capacity and supply (e.g., auto industry vying for the same fab capacity used by electronics makers), or
gaps in planning and collaboration processes (with supply chain partners), missing system capabilities, or simply not knowing whatinnovations are available to tackle lead-time unreliability. This is the purview of this write-up.
One of the primary needs is the ability to measure the lead-time of products – quickly and accurately. To date, planners, buyers and analysts, even in larger, well-run companies find themselves leaning on spreadsheets and “notes” (from their latest calls with supplies) when asked –
“What’s the lead time of XYZ product?” – their own product, which is getting supply constrained.
Most often, the product’s lead time data in their ERP systems is dated. Makes sense – most of the lead-time info in their ERP system is supplied by the buyer/planner’s spreadsheet.
For component parts and critical sub-assemblies that are procured from suppliers, product companies are often totally dependent on the lead-time data they get from their manufacturing partners – CM[1] in hi-tech electronics product makers or Tier 1 suppliers in automotive and other manufacturing-intensive supply chains. With an arms-length relationship with the eventual parts’ suppliers (either Tier 2, or sometimes upstream), it’s not surprising that these numbers fed to the product companies can be dangerously stale.
Astute operations and supporting IT teams understand these gaps– that ERP is a system for ‘recording’ (storing) lead-time data, and not designed to measure lead-time. They need a different approach, different processes to capture this data quickly and accurately, and often, a new enabling system.
Astute operations and supporting IT teams understand these gaps – that ERP is a system for ‘recording’ (storing) lead-time data, and not designed to measure lead-time. They need a different approach..
Tackling unreliable Lead times – Focus on right Process & System
However, before embarking on a project to plug the gap – ‘fix lead-time’ data and systems, it’s important to identify any bottlenecks in the end-to-end processes from demand through supply planning and all the steps that lead to the subsequent shipments from suppliers. For supply chains that are impacted by long lead-times on components that are further upstream of their Tier 1 supplier (or CM/ODM[2]), analyzing this end-to-end process is just a start, and may not close the gap due to variability in component lead-times.
If you have not done this, it is best to wrap your arms around product lead times looking at processes and interactions with the immediate upstream tier of supply, at the get go – i.e., between the product company and its Tier 1 supplier (CM/ODM).
Once the process bottlenecks and disconnects are removed, the company is in a position to systematically measure the lead-time of their products from this vantage point (with Tier 1 supplier).
As soon as companies gain visibility and some control over product lead time, they can plan the more demanding and potentially uncharted territory of expanding these processes to include critical Tier 2 supply.
Design for Implementation and usage
Once process related constraints are identified and resolved (via suitable agreements with supply chain partners to share data), companies can proceed to the next step, namely – providing a system enabler that works in simple manner to capture lead-times.
Specialized solutions built on the cloud are ideal, since most processes are executed collaboratively. Ensure that the system is fast to implement and quickly gains traction with all users, including the supplier users. A “large, ERP mindset” (‘small army’ of people, ‘large’ implementation centered) and ‘hit-and-miss’ post implementation stabilization and usage, is a sure shot to an expensive failure.
Take the lead with your Lead time
A recent article outlines our findings of new approaches and innovations in process and system from younger, dynamic growing product companies that are successfully scaling operations while facing larger competitors, as well as larger technology companies with leading supply chain operations practices, both of which have navigated supply chain disruptions – large and small.
Use the information from this article to brainstorm with your senior leaders (CEO/ COO) specific areas that need to be re-thought through and acted upon, both at a macro and micro-process level
For example, in the case of macro-process, answer key questions such as –
How can product Lead times be measured systematicallywhich is closer to reality (if not real-time)?
What is the end-to-end process and supporting system needed that canmeasure lead-times accurately?
What is the end-to-end process and supporting system needed that canmeasure lead-times accurately?
For micro-process dive into specific processes and system changes that are economically implementable, such as –
A Lead-time review process to identify lead time outliers and take corrective actions rapidly.
Ideas from the above referenced article can help you define the extent of your lead time challenges and opportunities, providing you an outline of a few key process and system areas that need to be rethought, redesigned (as needed) and retooled. Use these to bring your lead-time picture into much sharper focus, gaining an operating advantage in the process.
Lead time requires focused leadership on process and system. Falling behind is not an option.
*Please email contactus@zyom.com with questions or additional information needs.
[2] ODM = original design manufacturer (using in hi-tech electronics supply chains)
[1] CM = contract manufacturer (in hi-tech electronics supply chain)
Making a company scale is vital. For hardware product companies (offering physical goods), this is especially key when technology is still in its early stages of adoption. Scaling early provides a solid competitive anchor in the markets they serve, making it harder for follow-on competition to achieve similar scale or size. Most research and case-studies have overlooked a very important piece of the scaling puzzle – scaling operations effectively and rapidly – both the Demand and Supply-side.
The author derives ideas and inspiration from an example of scale available to us in abundance – that of us, Humans, and attempts to answer the following question –
Why is it that some companies can achieve scale and grow, while others in the same or similar industry with promising products cannot?
Utilizing experiential evidence of scale from directly working with a company that scaled significantly in a short period, and utilizing direct and indirect knowledge from other companies, including past experiences, the author arrives at, what could be fairly counter-intuitive answers.
One specific capability in particular stands us in good stead.
What is this capability? How to develop & utilize this capability?
This article could give you some fresh ideas as you plan to scale in the new year (2019).
To Scale is Human – Evidence from the long arc of Pre-history
Travelling back into the mists of time, an alien would have wondered, looking at us – the Human species, whether we could even make it past a few millennia.
The Homo Sapiens were not the best equipped, the strongest, of great size or anything spectacular to have survived, let alone thrive on Planet Earth.
There were many competing “human like” species (Hominins), some stronger, many better adapted for the conditions they were living in (Neandertals in Europe, Denisovans in Asia, among others).
Somehow, we survived and they did not. Somehow, we were able to not only overtake the other Hominins on their home turf, but we went from strength to strength until, ours was the only surviving human-like species left.
Today, we dominate the planet, and have changed the geography of the planet, not just the history. When it comes to scale among living beings, there is no better example than us – Humans (1,6).
How did this come about? Many things appear to have happened along the way, corroborated by scientists. One in particular stands out – we gathered beneficial mutations – physical, cognitive and social – along the way.
While there are different views on how it came about –
the single most beneficial “mutation” that the H. sapiens evolved was the propensity for active collaboration with totally unrelated individuals.
This singular ability of ‘being able to engage with others in complex, social activities towards joint goals’ – scientists conclude – is one of the key reasons the modern human (H. sapiens) survived, outlasting other hominins (2,3).
So, how is this related to the operating success of the modern-day enterprise.
Using experiential evidence from a company going through critical phases of its development life-cycle, in a young market-space, we would like to share how this ability of being ‘peerless collaborators’ is a critical capability that separates the best run companies from the also rans.
The tide is turning. Channel partners and key customers are moving fast to your products..
Just as you were preparing to hear the beautiful humming sound of a well-oiled Operating machine shipping products out – you hear some ugly, jarring noises –
‘Hot-selling product has gone on allocation’
‘Big Channel partners are getting frustrated, as lead times start creeping up’
What happened? The Critical ‘O’-Zone
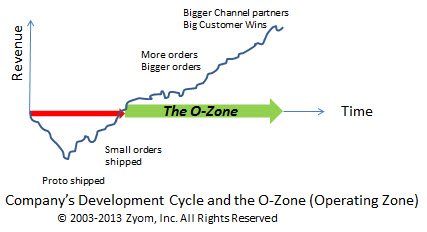
First, the good news – You have reached a major inflection point in your development cycle. You are no longer a small, obscure supplier waiting for the next large order. Orders are now waiting for you. Congratulations!
The not-so-good news – these orders will not wait long before they jump ship to a competitor.. Channel partners may divert attention to these competitors too.. So, what happened?
You just entered what we call the ‘O’ Zone (the “Operating” Zone). This is that part of your lifecycle (“zone”) when customers want to see you Operate like clockwork– shipping out 10x, 100x or more volume than before, yet meeting delivery dates globally, at attractive price points.
What happens in this vital phase of your Company’s development cycle is going to be determined in a big way by a critical collaboration – Near Real-time Collaboration between your Salesand Manufacturing/ Supply Chain Operations (Ops) team.
What’s causing these pains? No ‘growing pains’ is not a good label. Here is a critical one–
Divergent metrics & its impact on Sales & Operations
Your Sales team is focused on hyper-growth – signing up new Channel partners, winning new deals with end customers despite tough competition.
They are totally focused on order volume (Revenue) metrics, and compensated appropriately. So, they make sure they open up the gates and get more customers, more partners and more orders in. But hold on!
Do they have enough time to pivot to their Ops partners – give them a heads up about new customers, what product forecasts will be like?
Your Ops team, on the other hand, has an increasingly complex balancing act as demand takes off. They can grow their Supply Networks – to an extent (signing up new sources – new CM/ ODMs, new suppliers, etc.) to gain extra capacity, but then they hit the brick wall – of ‘Cost’ centered metrics.
The strains start to show in interactions between Sales & Ops.
The offshoot of all this is not pretty – As orders increase, Ops fulfillment can be in lock step only for a little while, after which demand and supply diverge. For Ops, it becomes a guessing game –
Q. What will Sales sell? How much buffer stock should we keep?
For Sales it becomes a hand-wringing exercise, as they field questions from customers –
Q. When will our orders ship? Why can’t you deliver it sooner?
With ‘Keep cost down’ as the guiding principle for Ops, it becomes a crazy dash to expedite when demand swings up with little notice, flying goods over instead of the more inexpensive modes (sea, rail or road) – depleting margins.
The human costs are bigger – anxieties mount as Sales & Ops try to play a game which looks somewhat like – catch the ball ‘blindfolded’.
Key to growth – A Vital, Systematic collaboration
In the O-Zone (operating zone) we need to play carefully – Pay special heed to the needs of this collaboration which is vital for growth –
Between Sales & Supply Chain Operations
To start off – Metrics need to be aligned.
How about rallying both Sales & Ops around ‘Profitable Growth’ metrics?
Let’s discuss it as a team at the leadership levels first. At a minimum – Sales, Supply Chain Operations, Operational Finance and you, should participate. The dividends of playing smart in the O-Zone are huge – Growth with Profitability – A distinct Operating Advantage. We, at Zyom, will be glad to help and explain further.
The most serious Risk that Companies with extended supply chains face is – the ShortageRisk. In the wake of the Japanese earthquake and tsunami[i], the floods in Thailand and a fire that took significant capacity of a critical automotive industry resin offline[ii] – ‘major supply shocks’ have taken center stage. But these are only a small subset of the Shortage risks that Companies and their Supply Chains face.
Often, the more mundane, ‘garden variety’ shortages that Companies face on a daily basis, can pack a vicious punch – making a serious dent in a company’s competitiveness, if not pushing it off the cliff!
Let’s understand why Shortages are the biggest risk now and examine potential warning signs that shortages maybe just around the corner.
The Destructive Impact of Shortages: For the want of a nail..
Shortages impact all companies downstream of the manufacturer facing shortages – to varying degrees. Sometimes, shortages can cut across industries.
For example, if Amazon buys up significant capacity of TFT glass (a specialized LCD used in different products) for its next new Kindle launch, that can cause shortages in unrelated industries – such as at video-game makers or electronic-toy makers. Even, the most agile Operations executives can get blindsided in such cases.
The impact of shortages can be severe. Dynamic young companies trying to ship products, stand to lose a lot. But even larger companies are not immune (Smartphone Biz Hurt by Own Success as Chip Supply Shrinks[iii]). Beyond the obvious Revenue impact, shortages can:
– turn away new customers (revenue hit),
– put-off existing customers (satisfaction erodes, loyalty and customer lifecycle value diminishes),
– cause unintended consequences (long lead-time for large companies downstream or an entire industry[iv])
– worse (perception of poor management controls, even if incorrect, adverse competitive impact[v])
Any one of these is bad enough. Their compounding effect can be devastating.
Avoid getting Blindsided – Warning Signs
At a time of such a tepid recovery, leadership across companies of all sizes should take note of this threat and ask – What are the warning signs that we are exposed? Here are a few critical ones we have found helpful:
1) Frequent over-forecasting by Channel partners and Field Sales – Manufacturing Operations team frequently asked to jump through hoops to increase shipment quantities at short notice, often to find later that forecasts were lowered.
2) Dependence on very few suppliers – OEMs totally dependent on few Contract Manufacturers (in the Hi-tech electronics industry) or Tier1 suppliers (in the Auto industry) who are also major suppliers for other competitors. BOMs with a high percentage of single-sourced items should also throw up red flags.
3) Visibility limited to key suppliers in the first tier of supply only– For an OEM this means having the ability to manage and monitor the performance of direct suppliers only, in the best case (CM/ODMs or Tier1 Suppliers [vii]), and no visibility beyond that[vi].
4) Frequent Allocations sometimes even on ‘run rate’ products – For products that start approaching stable sales patterns, alarms should go off if shortages occur, before these products go on hard ‘allocation’.
5) Quarterly Business Reviews (QBR) with suppliers showing ‘strain’ or going ‘too smoothly’– If QBRs with Supply Chain partners start showing strains due to unplanned costs,etc.– that’s an early warning. Dangers may also be lurking, if no disagreements arise.
6) Total time to respond to demand changes is unknown or too long – When it takes too long to answer – “How long will it take to ship a 10% upside?” or the range is too wide (“a few hours to a few days”) – that’s a red flag.
There are exceptions to the above. However, time and again, across different companies and industries we have found the above provide a good check-list to harden Supply Chain processes and systems against shortages.
Have you been part of a recent ‘shortage event? Did you see any other warning signs? Other Supply Chain risks that are bigger?
[i] Japan and the global supply chain: Broken links; The Economist; March 31st, 2011


")
